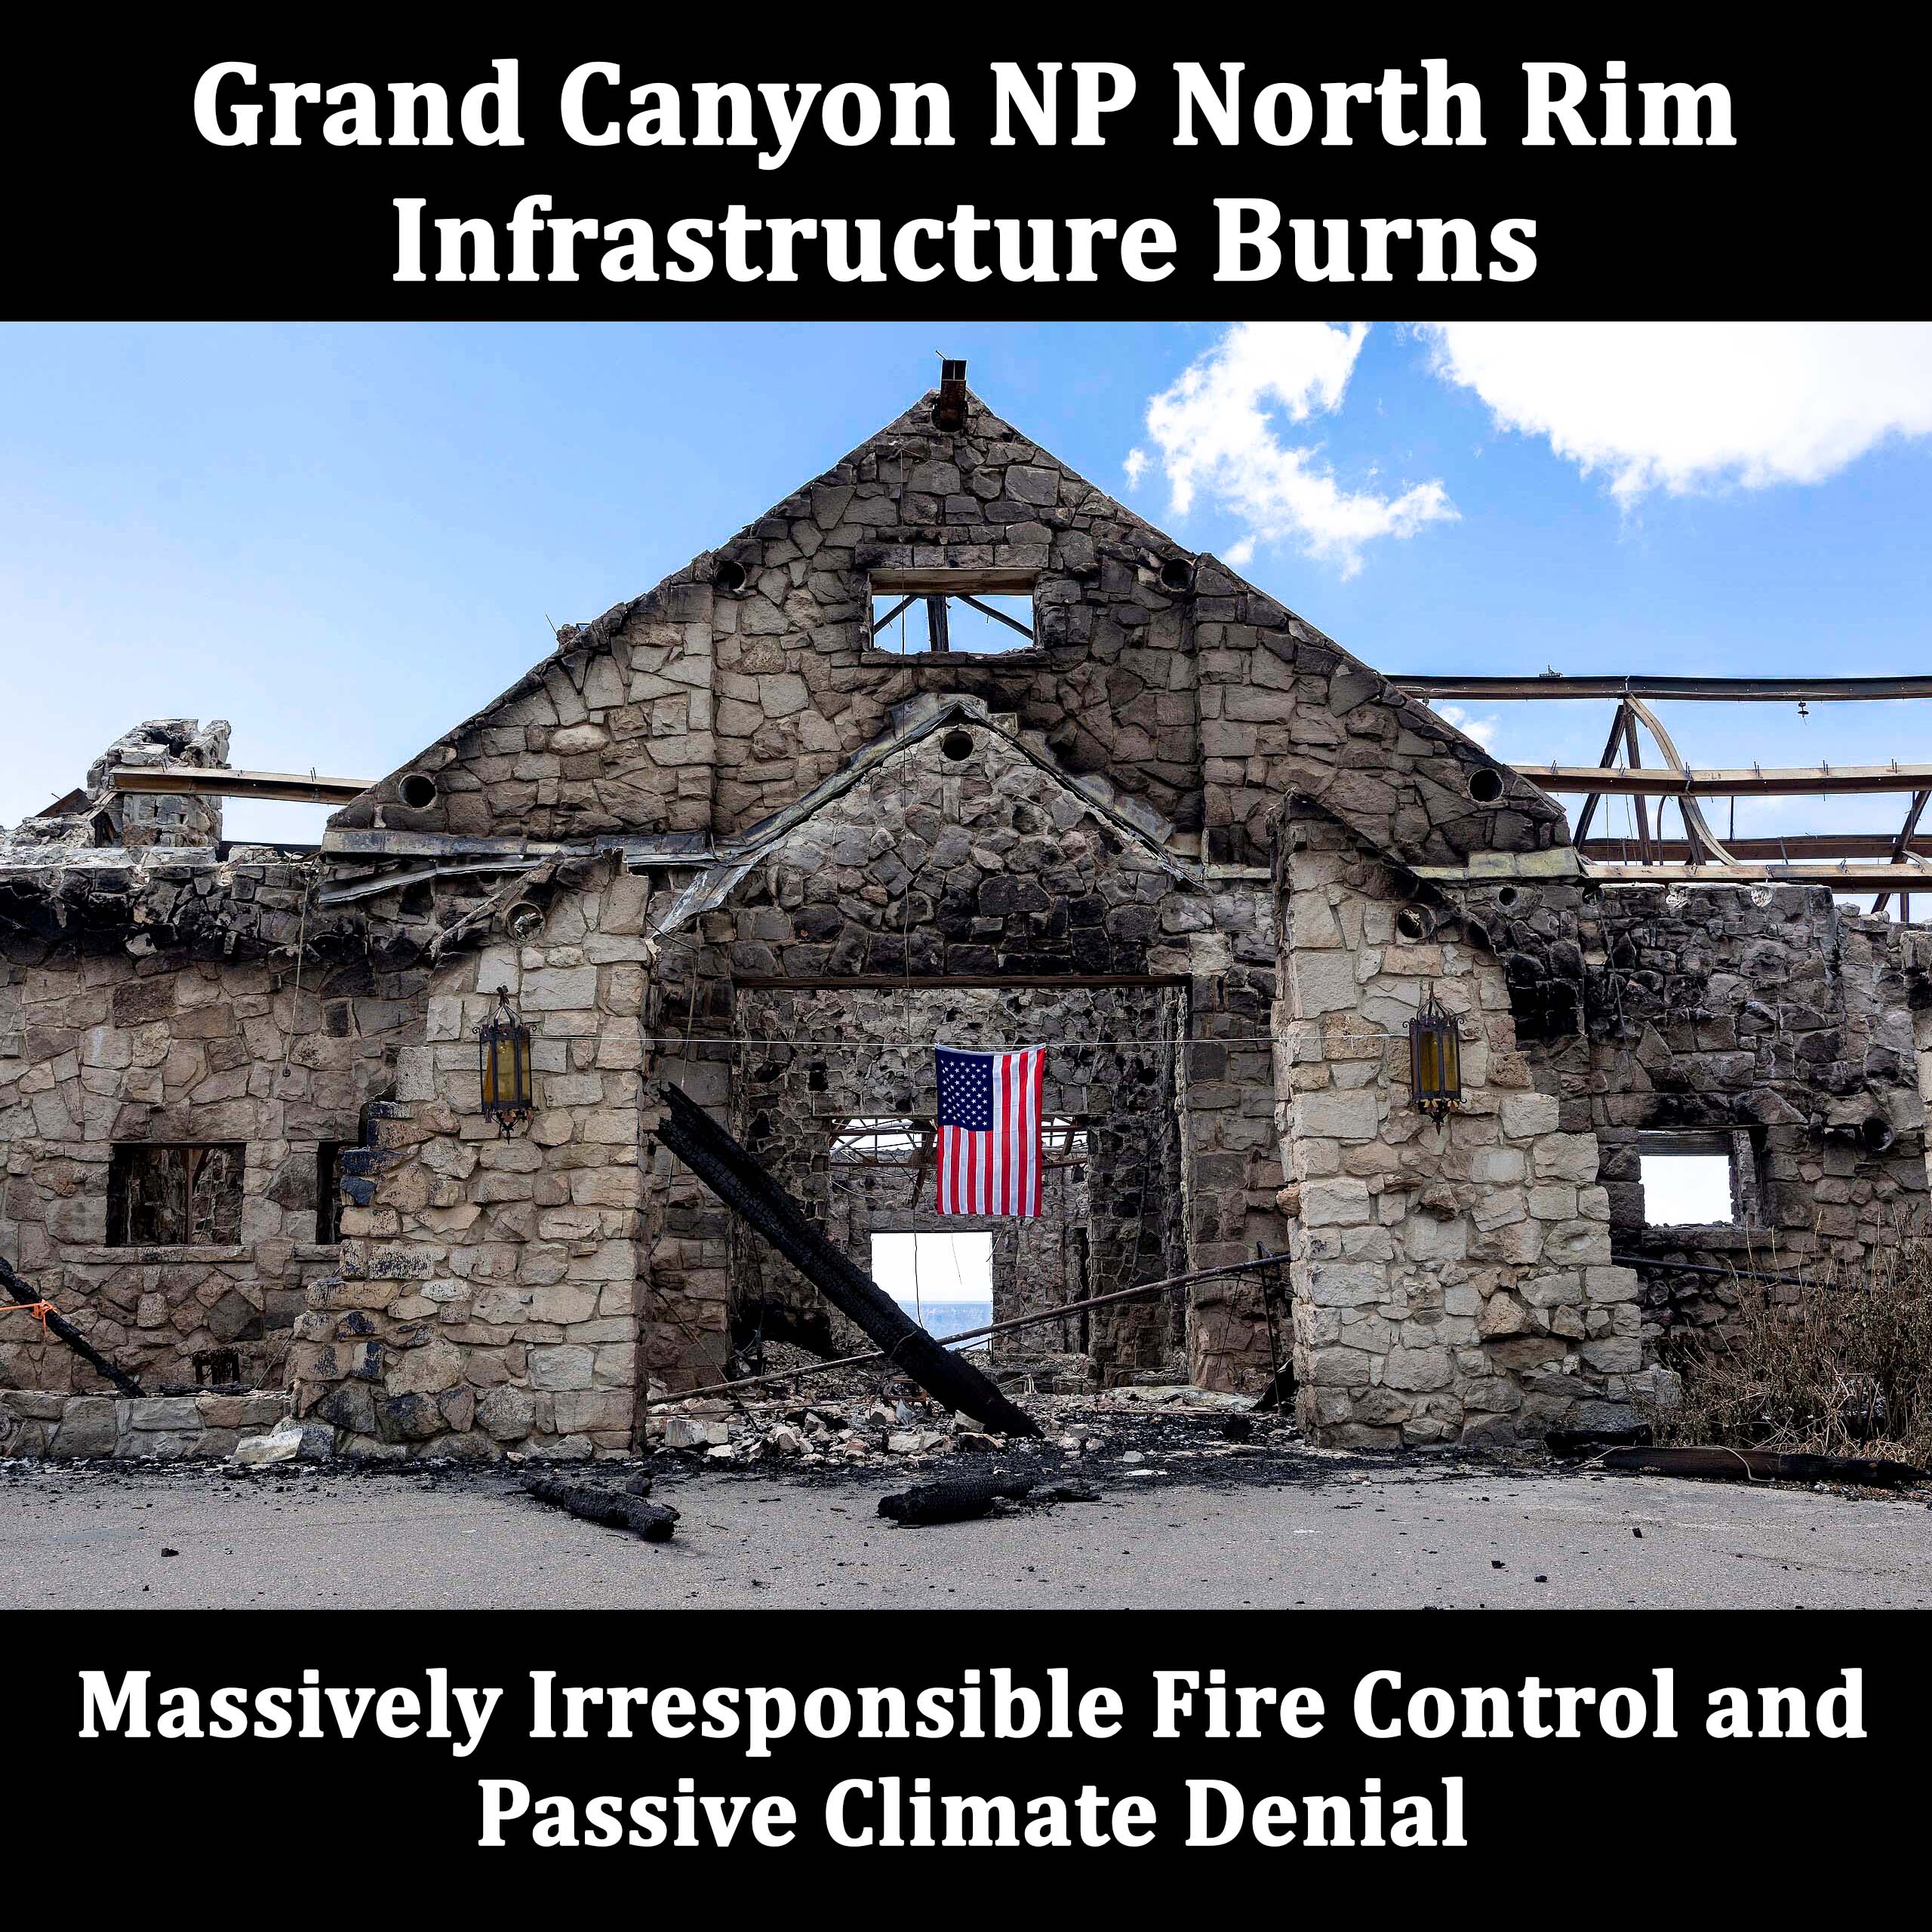

Grand Canyon National Park North Rim Infrastructure Destroyed – Massively Irresponsible Fire Control and Passive Climate Denial
Nary a word about climate change in reporting of the fire that destroyed almost all infrastructure at the North Rim of the Grand Canyon, including the historic Grand Canyon Lodge. It’s not just our national treasures that are at stake. Orr current Administration’s anti-climate science bent is but one factor that caused the destruction of one of our nation’s -the world’s- greatest treasures.
The National Forest (NFS) and Park Services (NPS) made yet another horrendous climate change prescribed burn mistake. One would think they would learn after an identical error just three years ago, 375 miles due east, when the largest fire in New Mexico history, the Calf Canyon/Hermits Peak Fire, was caused by not one, but two prescribed burns gone mad because of climate change. The NFS and NPS decided to treat the Dragon Bravo Fire that burned the north rim facilities of the National Park as a prescribed burn in defiance of numerous findings that prescribed fire in a warmed climate is a bad idea.
For a couple of generations now, prescribed burns have been the cure-all for perceptions of our ailing forests. The cure goes, “fire suppression during the Smoky Bear era beginning early in the 20th century, has created overcrowded forests that are unhealthy. Controlled burns that are very minor fires, serve as medicine for these forests by clearing out the congestion and allowing the forest to return to its former health. This cure-all may have been valid before our climate warmed far beyond the evolution of our Earth systems, but no more. It is simply too dry.
Some continue to believe that they can trick Mother Nature by creating prescribed burns anyway, using extra precautions, burning when it’s wetter, or not as windy, or cooler, or crossing their fingers like they did when a prescribed burn in Bastrop State Park went out of control after the historic Bastrop complex fire in 2011. These burn bosses are not using skill, they were following what they believed to be appropriate rules for prescribed burn, and they were, in our old climate. Times have changed. Remember your physics classes please. A little warming does not create a little more dryness, it creates a lot more in a highly nonlinear process. Our world’s engineering criteria, that were developed in a cooler, wetter world, no longer work in our warmed world. Literally – they fail, time and again. Fire, flooding, drought, cold – failed engineering design criteria are now being found across the planet as climate change and weather related disasters have increased by seven times in the last 40 years.
The National Forest Service let Dragon Bravo Fire burn to mimic prescribed fire, as was commonly done by the National Forest Service and others in our old climate. When the Calf Canyon/Hermit’s Peak prescribed burn ran out of control and created the largest fire in New Mexico history, the National Forest Service ordered a 90 day moratorium on prescribed burns nationwide so they could evaluate what went wrong with the Calf Canyon/Hermits Peak Fire and modify their prescribed burn criteria. This they did, changing or adding seven new precautions to prevent prescribed burns from going out of control. Yet the Drang Bravo fire went out of control regardless. Dragon Bravo has now burned 132,000 acres since its ignition on July 4 and as of August 8, a red flag warning was in place with winds gusting to 40 mph.
One would think, and over the last ten years this has been true; our National Forest Service and our National Park Service have both shed the their climate change phobia and adopted the position of science. But, this behavior has now evaporated in the heat of our current administration’s illegitimate actions.
The findings below are clear. It is not just the first section on the incredible increases in fire behavior on our warmed planet. that cannot be attributed to increased fuel loading from fire suppression, it is the findings in the second section too, that prescribed fire no longer works like it did in our cooler wetter climate. It’s not just average global warming of 1.6 degrees C above normal; It is double this because warming over land is twice the global average because of our cool oceans and ice sheets, of 5.7 degrees F. It is not just average warming over land because extremes increase nonlinearly with warming, meaning extreme heat is much more than double the average global warming. It is not just nonlinearly increasing moisture deficit because of the heat-evaporation relationship where a little warming does not create a little more evaporation, it creates a lot more. And it is not just all of the above because dry periods are becoming longer and longer drying again, creates nonlinearly less water in the environment that keeps wildfire from behaving extremely.
~ ~ ~
Climate Change-caused Wildfire References
August 31, 2024 – Canada’s 2023 wildfires top 4 global emitters… “ The wildfires that ravaged Canada’s boreal forests in 2023 produced more planet-warming carbon emissions than the burning of fossil fuels in all but three countries, research published on Wednesday has found. Only China, the United States and India produced more emissions from fossil fuels than the Canadian fires, according to the study, which was published in the journal Nature. The wildfires last year call into question how much carbon the forests will absorb in the future, scientists said. That, in turn, may make it necessary to reconsider calculations of how much more greenhouse gas humans can add to the atmosphere without pushing temperatures beyond current global targets.”
https://www.nytimes.com/2024/08/28/climate/canada-wildfires-emissions-carbon.html
Extreme fire weather days have more than doubled since 1980 in California… “Observed frequency of autumn days with extreme (95th percentile) fire weather—which we show are preferentially associated with extreme autumn wildfires—has more than doubled in California since the early 1980s.”
Goss et al., Climate change is increasing the likelihood of extreme autumn wildfire conditions across California, Environmental Research Letters, August 20, 2020.
https://iopscience.iop.org/article/10.1088/1748-9326/ab83a7/pdf
400 Degrees Hotter… Wildfires are burning 400 degrees F hotter because of drier fuels. “The infernos bellowed by those winds once reached a maximum temperature of 1,700 degrees Fahrenheit, Cal Fire’s Angie Lottes says; now they reach 2,100 degrees, hot enough to turn the silica in the soil into glass.”
Wallace-Wells, Los Angeles Fire Season Is Beginning Again. And It Will Never End. A bulletin from our climate future.
By David Wallace-Wells, NYMag, May 12, 2019.
http://nymag.com/intelligencer/2019/05/los-angeles-fire-season-will-never-end.html
Ignitions increased six times with drier conditions and warmer temperatures… “annual ignitions observed during our study period (57 ignitions recorded between July 2020 and June 2021) was six times more likely under the temperature and VPD anomalies observed during the study than under the long-term average conditions (1961–1990).” Abstract, “… Once accounting for seasonal effects, ignitions increased with temperature and vapour pressure deficit anomalies and decreased with precipitation anomalies. These findings indicate that climatic conditions play a role in limiting ignition frequency via effects on fuel moisture. Our models predicted that warmer and drier conditions during our study caused considerable increases in ignition frequency compared to the long-term average reference period (1961–1990)…”
Wilson and Yebra, The Role of Climate in Ignition Frequency, Fire, May 10, 2023.
https://www.mdpi.com/2571-6255/6/5/195
The climate change connection… Summary and Conclusions: “most acute fire weather in over two decades… longest duration Santa Ana wind event in the 70-year record… the most extreme drought on record… lowest fuel moisture on record… driest March through December since 1895.”
Abstract: ” Two extreme wind-driven wildfire events impacted California in late 2017, leading to 46 fatalities and thousands of structures lost. This study characterizes the meteorological and climatological factors that drove and enabled these wildfire events and quantifies their rarity over the observational record. Both events featured key fire-weather metrics that were unprecedented in the observational record that followed a sequence of climatic conditions that enhanced fine fuel abundance and fuel availability. The North Bay fires of October 2017 occurred coincident with strong downslope winds, with a majority of burned area occurring within the first 12 hours of ignition. By contrast, the southern California fires of December 2017 occurred during the longest Santa Ana wind event on record, resulting in the largest wildfire in California’s modern history. Both fire events occurred following an exceptionally wet winter that was preceded by a severe four-year drought. Fuels were further preconditioned by the warmest summer and autumn on record in northern and southern California, respectively. Finally, delayed onset of autumn precipitation allowed for critically low dead fuel moistures leading up to the wind events. Fire weather conditions were well forecast several days prior to the fire. However, the rarity of fire-weather conditions that occurred near populated regions, along with other societal factors such as limited evacuation protocols and limited wildfire preparedness in communities outside of the traditional wildland urban interface were key contributors to the widespread wildfire impacts.”
Nauslar et al., The 2017 North Bay and Southern California Fires, A Case Study, Fire, June 9, 2018.
https://www.mdpi.com/2571-6255/1/1/18/htm
Exponential increase in extreme fire behavior from drying… “Increases in large wildfires associated with earlier spring snowmelt scale exponentially with changes in moisture deficit, and moisture deficit changes can explain most of the spatial variability in forest wildfire regime response to the timing of spring.”
Westerling, Increasing western US forest wildfire activity, sensitivity to changes in the timing of spring, Philosophical Transactions of the Royal Society B, May 23, 2016, abstract.
http://rstb.royalsocietypublishing.org/content/371/1696/20150178
Wildfire season increased 60 percent, burn time has increased 800 percent, burned area increased 1,271 percent, human-caused ignition has played a very small role in increasing wildfire trends… Westerling, Increasing western US forest wildfire activity, sensitivity to changes in the timing of spring, Philosophical Transactions of the Royal Society B, June 15, 2016, Table 2.
http://rstb.royalsocietypublishing.org/content/371/1696/20150178
Byrne 2024 – Canada’s 2023 wildfires emitted 647 Mt C, ranking fourth in the world by nation…
Byrne et al., Carbon emissions from the 2023 Canadian wildfires, Nature, August 28, 2024.
https://www.nature.com/articles/s41586-024-07878-z.pdf
Van der Velde 2021 – Emissions from the Australian Black Summer fires were 715 MT CO2, ranking 7th globally in 2020 by country…
Van der Velde et al., Vast CO2 release from Australian fires in 2019–2020 constrained by satellite, Nature, September 15, 2024.
https://research.vu.nl/ws/portalfiles/portal/152420184/Vast_CO2_release_from_Australian_fires_in_2019_2020_constrained_by_satellite.pdf
Lapenis and Yurgonov 2023 – Russian Wildfires in 2021 emitted 1.7 Gt CO2eq, ranking 5th globally by country…
Lapenis and Yurgonov, Increase in Arctic Oscillations explains most interannual variability in Russia’s wildfires, Frontiers in Forests and Global Change, September 25, 2023.
https://www.frontiersin.org/journals/forests-and-global-change/articles/10.3389/ffgc.2023.1188057/full
California Wildfires in 2020 emit twice the amount of carbon as that the total California emissions reductions from 2003 to 2019… “We first compared sectoral emissions to wildfire emissions, which indicate an approximate release of 127 mmtCO2e in 2020, nearly seven times the 2003–2019 mean. From 2003 to 2019, California’s GHG emissions declined by 65 mmt CO2e (-13%), largely driven by reductions from the electric power generation sector. The 2020 fire season alone is two times higher than California’s total GHG emissions reductions and would comprise 49 percent of California’s 2030 total greenhouse emissions target of 260 mmtCO2e (Fig. 1) (CARB, 2017).”
Jerret et al., Up in smoke: California’s greenhouse gas reductions could be wiped out by 2020 wildfires, Science Direct – Environmental Pollution, October 1, 2022.
https://www.sciencedirect.com/science/article/pii/S0269749122011022#bbib30
Average area burn area per fire in the US has increased by 400 percent and the number of fires has decreased by 20 percent… Fires are getting bigger and harder to control resulting in greater burned area, where prevention and education have resulted in fewer overall fires.
Wildfire Statistics, Congressional Research Service, October 3, 2022.
https://sgp.fas.org/crs/misc/IF10244.pdf
NASA on the 2020 Western Fire Season – the ten largest wildfires in California all happened in 2020… “Five of California’s 10 largest wildfires on record happened in 2020, and the state set a new record for acres burned. According to CAL FIRE, the state’s Department of Forestry and Fire Protection, more than 9,600 wildfires burned nearly 4.2 million acres through mid-December, causing more than 30 fatalities and damaging or destroying nearly 10,500 structure… Oregon, Washington, and Colorado were also particularly hard hit. In fact, as of mid-December 2020, the National Interagency Fire Center reported more than 10.6 million acres burned and nearly 17,800 buildings destroyed…
Buis, The Climate Connections of a Record Fire Year in the U.S. West, NASA Jet Propulsion Lab, February 22, 2021.
https://climate.nasa.gov/ask-nasa-climate/3066/the-climate-connections-of-a-record-fire-year-in-the-us-west/
Australian fires of 2020 created an unprecedented puncture of the stratosphere with a smoke column 50 percent higher than the tallest thunderstorm ever recorded and a 700 mile-wide ozone hole that persisted for thirteen weeks. The smoke persisted for 13 weeks generating an average cooling effect across the globe similar to a medium size volcanic eruption… “The Australian bushfires around the turn of the year 2020 generated an unprecedented perturbation of stratospheric composition, dynamical circulation and radiative balance. Here we show from satellite observations that the resulting planetary-scale blocking of solar radiation by the smoke is larger than any previously documented wildfires and of the same order as the radiative forcing produced by moderate volcanic eruptions. A striking effect of the solar heating of an intense smoke patch was the generation of a self-maintained anticyclonic vortex measuring 1000 km in diameter and featuring its own ozone hole. The highly stable vortex persisted in the stratosphere for over 13 weeks, travelled 66,000 km and lifted a confined bubble of smoke and moisture to 35 km altitude. Its evolution was tracked by several satellite-based sensors and was successfully resolved by the European Centre for Medium- Range Weather Forecasts operational system, primarily based on satellite data. Because wildfires are expected to increase in frequency and strength in a changing climate, we suggest that extraordinary events of this type may contribute significantly to the global stratospheric composition in the coming decades.”
Khaykin et al,. The 2019 to 20 Australian wildfires generated a persistent smoke-charged vortex rising up to 35 km altitude, Nature Communications Earth and Environmental, September 21, 2020.
https://www.nature.com/articles/s43247-020-00022-5.
Cunningham 2024 – Extreme fire (≥99.99th percentile) doubled globally, and increased 11.1 times in temperature coniferous forests and 7.3 times in the boreal/tiaga from 2003 to 2023… The last 7 years included the six most extreme years for energetically extreme wildfires. This work looks at very extreme fire alone (99.99th percentile) and finds no correlation except in temperate conifer forest at 11.1 times increase, and 7.3 times increase in the boreal and tiaga biomes. The “doubling” globally (2.2 times increase) is an average of all global biomes and misleading as no other biomes showed significantly increase extremeness.
Abstract, “Climate change is exacerbating wildfire conditions, but evidence is lacking for global trends in extreme fire activity itself. Here we identify energetically extreme wildfire events by calculating daily clusters of summed fire radiative power using 21 years of satellite data, revealing that the frequency of extreme events (≥99.99th percentile) increased by 2.2-fold from 2003 to 2023, with the last 7 years including the 6 most extreme. Although the total area burned on Earth may be declining, our study highlights that fire behaviour is worsening in several regions—particularly the boreal and temperate conifer biomes—with substantial implications for carbon storage and human exposure to wildfire disasters.’ “Biome-specific generalized linear models revealed that the global increase in extreme events was almost entirely driven by strong increases in the temperate conifer forest biome (Pyear = 0.00002, z statistic = 4.28) and the boreal forests and taiga biome (Fig. 2c; Pyear = 0.000003, z = 4.64). In the temperate conifer forest biome, the annual number of extreme events estimated by a generalized linear model increased by 11.1-fold, from 6 in 2003 to 67 in 2023 (Fig. 2c). Similarly, extreme events in the boreal forest biome increased by 7.3-fold, from a model-estimated 14.9 to 108.7, over the 21 years of the study (Fig. 2c). No significant trends were apparent in other biomes (Fig. 2c). The increasing trends in the boreal forest and temperate conifer forest biomes are in line with documented increases in mean FRP in those regions15.”
Cunningham et al., Increasing frequency and intensity of the most extreme wildfires on Earth, Nature Ecology and Evolution, June 24, 2024.
(Paywall) https://www.nature.com/articles/s41559-024-02452-2
Phys.org Review – https://phys.org/news/2024-06-extreme-wildfires-years-science.html
Area burned globally doubled 2001 to 2018, 10 times more in tropical forests…
MacCarthy et al., New Data Confirms: Forest Fires Are Getting Worse, World Resources Institute, August 17, 2022.
https://www.wri.org/insights/global-trends-forest-fires
Full paper – Tyukavina et al., Global Trends of Forest Loss Due to Fire From 2001 to 2019, Frontiers in Remote Sensing, March 15, 2022.
https://www.frontiersin.org/articles/10.3389/frsen.2022.825190/full
California’s 100-year carbon credit buffer pool has almost completely burned, mostly in fires in 2020 and 2021, showing extreme lack of permanence… “Wildfires have depleted nearly one-fifth of the total buffer pool in less than a decade, equivalent to at least 95 percent of the program wide contribution intended to manage all fire risks for 100 years. We also show that potential carbon losses from a single forest disease, sudden oak death, could fully encumber all credits set aside for disease and insect risks. These findings indicate that California’s buffer pool is severely undercapitalized and therefore unlikely to be able to guarantee the environmental integrity of California’s forest offsets program for 100 years.” … “Estimated carbon losses from wildfires within the offset program’s first 10 years have depleted at least 95 percent of the contributions set aside to protect against all fire risks over 100 years.” … “the potential carbon losses associated with a single disease (sudden oak death) and its impacts on a single species (tanoak) is large enough to fully encumber the total credits set aside for all disease- and insect-related mortality over 100 years.” … “From the program’s inception through our study cut-off date of January 5, 2022, a total of 31.0 million credits (13.4 percent) had been contributed to the buffer pool out of a total 231.5 million issued credits, such that the 31.0 million buffer pool credits insure a portfolio of 200.5 million credits against permanence risks.”
Badgley et al., California’s forest carbon offsets buffer pool is severely undercapitalized, Frontiers in Forests and Global Change, August 5, 2022.
https://www.frontiersin.org/articles/10.3389/ffgc.2022.930426/full
Extreme wildfires in California are responsible for 97 percent of the area burned in California in the last two decades… have increased significantly in the last two decades with the cause being climate warming related…
“Between 2000 and 2019, compared to 1920 to 1999, the proportion of extreme wildfires larger than 10,000 acres (40.47 km2 ) has increased significantly… The burned area of large wildfires accounted for 97.04 % of the total burned area (13,089.68 out of 13,488.19 thousand acres, that is 52,972.05 out of 54,584.77 km2 ) in the past two decades… The frequency and burned area growth of wildfires in the past two decades are much higher than that during the 80 years in history from 1920 to 1999… The frequency of large wildfires and the burned area of small wildfires in the recent 20 years even have decreased… From 2000 to 2019, the frequency of wildfires in July increased significantly and became much more considerable than in other months. Meanwhile, the start of the wildfire season has also advanced to May (from June) and the duration has increased each month… there has been a major increase in the natural wildfires in July in the past two decades.”
Summary: “We found that the frequency and total burned area of all wildfires have increased significantly. The start time and peak months of the wildfire season have been advanced, and the covered months have been lengthened. For large and small wildfires, the annual frequency of large wildfires has remained stable for the last 100 years, but the total burned area has increased rapidly in the past two decades… illustrat[ing] that the comprehensive environmental conditions, such as changes in climate and vegetation, have increased the coverage of potential wildfire ignitions… slope, temperature and maximum vapor pressure deficit have positive correlation with wildfire occurrence… natural factors, especially climate variables, have a greater impact on the density of wildfires.”
Li and Banerjee, Spatial and temporal pattern of wildfires in California from 2000 to 2019, Nature Scientific Reports, April 22, 2021.
https://www.nature.com/articles/s41598-021-88131-9
Average area burn area per fire in the US has increased by 400 percent and the number of fires has decreased by 20 percent… Fires are getting bigger and harder to control resulting in greater burned area, where prevention and education have resulted in fewer overall fires.
Wildfire Statistics, Congressional Research Service, October 3, 2022.
https://sgp.fas.org/crs/misc/IF10244.pdf
Prescribed Burns Not Behaving Like in Our Old Climate
New Mexico’s two largest fires ever recorded happened in 2022, Calf Canyon (341,735 acres) and Black (325,136). The third largest wa Whitewater Baldy in 2012 at 297,845 acres. Calf Canyon caused by two prescribed burns out of control…
https://www.johnstonsarchive.net/other/newmexicowildfires.html
Cerra Pelado (Los Alamos – 46,605 acres)) and Calf Canyon were both escaped prescribed burns…
Lohman, Federal review prompted by NM wildfire warns of staffing shortfalls for future prescribed burns, Utah News Dispatch, July 11, 2024.
https://utahnewsdispatch.com/2024/07/11/federal-review-warns-of-staffing-shortfalls-for-prescribed-burns/#:~:text=That%20fire%20and%20the%20Calf,in%20New%20Mexico%20in%202022.
Prescribed fire management needs new rules… (Australian megafires 2019 – 2020) Prescribed burn season has shifted to wintertime because of extreme drying with warmer temperatures. New strategies are needed to create safety in dryer times. Burn area increased 800 percent 1988-2001 to 2019-2020. The 2019-2020 fires created 429 premature deaths. Smoke inhalation health costs increased by 900 percent from the previous 19 years. The firesc created 44 pyrocumulonimbus events, representing 35% of all pyrocumulonimbus since monitoring began in 1978. These events injected 1 Tg smoke into the stratosphere.
Bowman and Sharples, Taming the flame, from local to global extreme wildfires, Science, August 11, 2023.
https://www.science.org/doi/epdf/10.1126/science.adi8066
Prescribed burning significantly reduces carbon storage – California Carbon stocks in 2069 modeled at 25 percent of today’s values with 870 megatons net emissions in the next 50 years… With restoration of forests using fuels reductions strategies that reduce the number of trees per acre, in combination with both current and additional warming that favors lower tree density and more pines, total carbon storage in California’s forests in 2069 is only 25 percent of carbon storage today.
Abstract, “Restoration of fire-prone forests can promote resiliency to disturbances, yet such activities may reduce biomass stocks to levels that conflict with climate mitigation goals. Using a set of large-scale historical inventories across the Sierra Nevada/southern Cascade region, we identified underlying climatic and biophysical drivers of historical forest characteristics and projected how restoration of these characteristics manifest under future climate. Historical forest conditions varied with climate and site moisture availability but were generally characterized by low tree density (∼53 trees ha−1 ), low live basal area (∼22 m2 ha−1 ), low biomass (∼34 Mg ha−1 ), and high pine dominance. Our predictions reflected broad convergence in forest structure, frequent fire is the most likely explanation for this convergence. Under projected climate (2040–2069), hotter sites become more prevalent, nearly ubiquitously favoring low tree densities, low biomass, and high pine dominance. Based on these projections, this region may be unable to support aboveground biomass >40 Mg ha−1 by 2069, a value approximately 25% of current average biomass stocks. Ultimately, restoring resilient forests will require adjusting carbon policy to match limited future aboveground carbon stocks in this region.” and, “Based on the relationship between AGLB and total biomass (supplementary figure 8), these forests store a total of 1,167 MMT CO2e. We project that the median AGLB in 2069 will be no more than 40 Mg ha−1, which translates to 307 MMT CO2e stored in the total biomass pool. These extrapolations suggest that this region could emit 860 MMT CO2e over the next 50 years (2019–2069). Liang et al (2017a) projected the Sierra Nevada’s carbon carrying capacity under climate-wildfire interactions through the late 21st century and found that the region could lose as much as 78% of current aboveground carbon stocks, which aligns with our projections of climate resilient forests supporting <25% of current AGLB.”
Bernal_ et al., Biomass stocks in California’s fire-prone forests, mismatch in ecology and policy, Environmental Research Letters, March 25, 2022.
https://iopscience.iop.org/article/10.1088/1748-9326/ac576a/pdf
Increased frequency of disturbance decreases carbon storage, particularly in management practices that emphasize prescribed fire… “Our results suggest increasing the frequency of disturbances (a lower DRI) would reduce the percentage of high-severity fire on landscape but not the total amount of wildfire in general. However, a higher DRI reduced carbon storage and sequestration, particularly in management strategies that emphasized prescribed fire over hand or mechanical fuel treatments…Climate change is moving the landscape toward becoming a carbon source (Fig. 3, left). This can be moderated or accelerated by the type of management actions taken on the landscape, which is reflected in the different management areas present (see Table 3). Higher removals of biomass (whether from combustion of litter/downed woody material or from higher mortality than other forms of treatment) by prescribed fires in Scenarios 4 and 5 on the landscape affected the carbon balance (Fig. 3, right), where both live and dead C pools decreased through time… Our analysis suggests that, with the management approaches tested, there was a trade-off between C storage and fire severity. Although a lower DRI reduced high-severity fire, the net effect was reduced C storage.”
Maxwell et al., Frequency of disturbance mitigates high-severity fire in the Lake Tahoe basin, Ecology and Society, 2022.
https://www.fs.usda.gov/research/treesearch/63891
Regardless of prescribed burn treatment, fire weather conditions in Australia resulted in a doubling of fire risk across all categories … “There is an imperative for fire agencies to quantify the potential for prescribed burning to mitigate risk to life, property and environmental values while facing changing climates. The 2019–2020 Black Summer fires in eastern Australia raised questions about the effectiveness of prescribed burning in mitigating risk under unprecedented fire conditions. We performed a simulation experiment to test the effects of different rates of prescribed burning treatment on risks posed by wildfire to life, property and infrastructure. In four forested case study landscapes, we found that the risks posed by wildfire were substantially higher under the fire weather conditions of the 2019–2020 season, compared to the full range of long-term historic weather conditions. For area burnt and house loss, the 2019–2020 conditions resulted in more than a doubling of residual risk across the four landscapes, regardless of treatment rate (mean increase of 230%, range 164–360%). Fire managers must prepare for a higher level of residual risk as climate change increases the likelihood of similar or even more dangerous fire seasons.”
Clarke et al., The 2019–2020 Australian forest fires are a harbinger of decreased prescribed burning effectiveness under rising extreme conditions, Nature, July 13, 2022.
https://www.nature.com/articles/s41598-022-15262-y
Fire suppression and fuels management (prescribed burning generally) are inadequate to address a new era of western wildfire… “Policy and management have focused primarily on specified resilience approaches aimed at resistance to wildfire and restoration of areas burned by wildfire through fire suppression and fuels management. These strategies are inadequate to address a new era of western wildfires. In contrast, policies that promote adaptive resilience to wildfire, by which people and ecosystems adjust and reorganize in response to changing fire regimes to reduce future vulnerability, are needed. Key aspects of an adaptive resilience approach are (i) recognizing that fuels reduction cannot alter regional wildfire trends; (ii) targeting fuels reduction to increase adaptation by some ecosystems and residential communities to more frequent fire; (iii) actively managing more wild and prescribed fires with a range of severities; and (iv) incentivizing and planning residential development to withstand inevitable wildfire. These strategies represent a shift in policy and management from restoring ecosystems based on historical baselines to adapting to changing fire regimes and from unsustainable defense of the wildland–urban interface to developing fire-adapted communities. We propose an approach that accepts wildfire as an inevitable catalyst of change and that promotes adaptive responses by ecosystems and residential communities to more warming and wildfire.”
Schoennagel et al., Adapt to more wildfire in western North American forests as climate changes, PNAS, February 24, 2017.
https://www.ncbi.nlm.nih.gov/pmc/articles/PMC5422781/pdf/pnas.201617464.pdf