
Lipscomb 2025 – Sea level rise projection planning based on statistical certainty and robust science (never mentioning risk)… Recent Antarctic-based sea level rise findings have consistently lowered future SLR amounts based on refined modeling of ice discharge mechanisms of the Antarctic Ice Sheet and Shelves. This evaluation of recent Antarctic ice loss SLR science seeks to make sense of the body of findings by focusing on scientific certainty (probability of occurrence) and robustness (repeated findings with similar results), without mention of risks of high-end scenarios. This probability and robustness-based evaluation strategy is a classic understating mechanism for science and consensus reviews that occur in the absence or near absence of physical evidence, where modeling of future ice loss has no robust analog from which to be confirmed. For many aspects of climate science, this has resulted in projections of effects of warming being broadly understated, or biased low. (see Impacts Happening Ahead of Projections https://climatediscovery.org/Impacts_Happening_Ahead_of_Projection_051223.docx )
Focusing only on scientific certainty and robustness in modeling reveals a poor understanding of possible futures when considering the track record of probability-based scientific climate change effects projections. Evidence-based paleo evidence shows ten feet or more SLR per century (notes). Reticence in science, or the fear of losing credibility from exaggeration, is a powerful effect in the world of statical significance yet, time and again, modeling projections of warming effects have been shown to be biased low. This is a known and significant bias. Even so, our industry of climate science continues to base their projections not on risk, but low-biased statistical certainty and time-based robustness of findings when time itself prevents robustness with climate change happening faster than the speed of science.
Lipscomb et al., Brief communication – Sea-level projections, adaptation planning, and actionable science, Cryosphere, February 21, 2025.
https://tc.copernicus.org/articles/19/793/2025/tc-19-793-2025.pdf
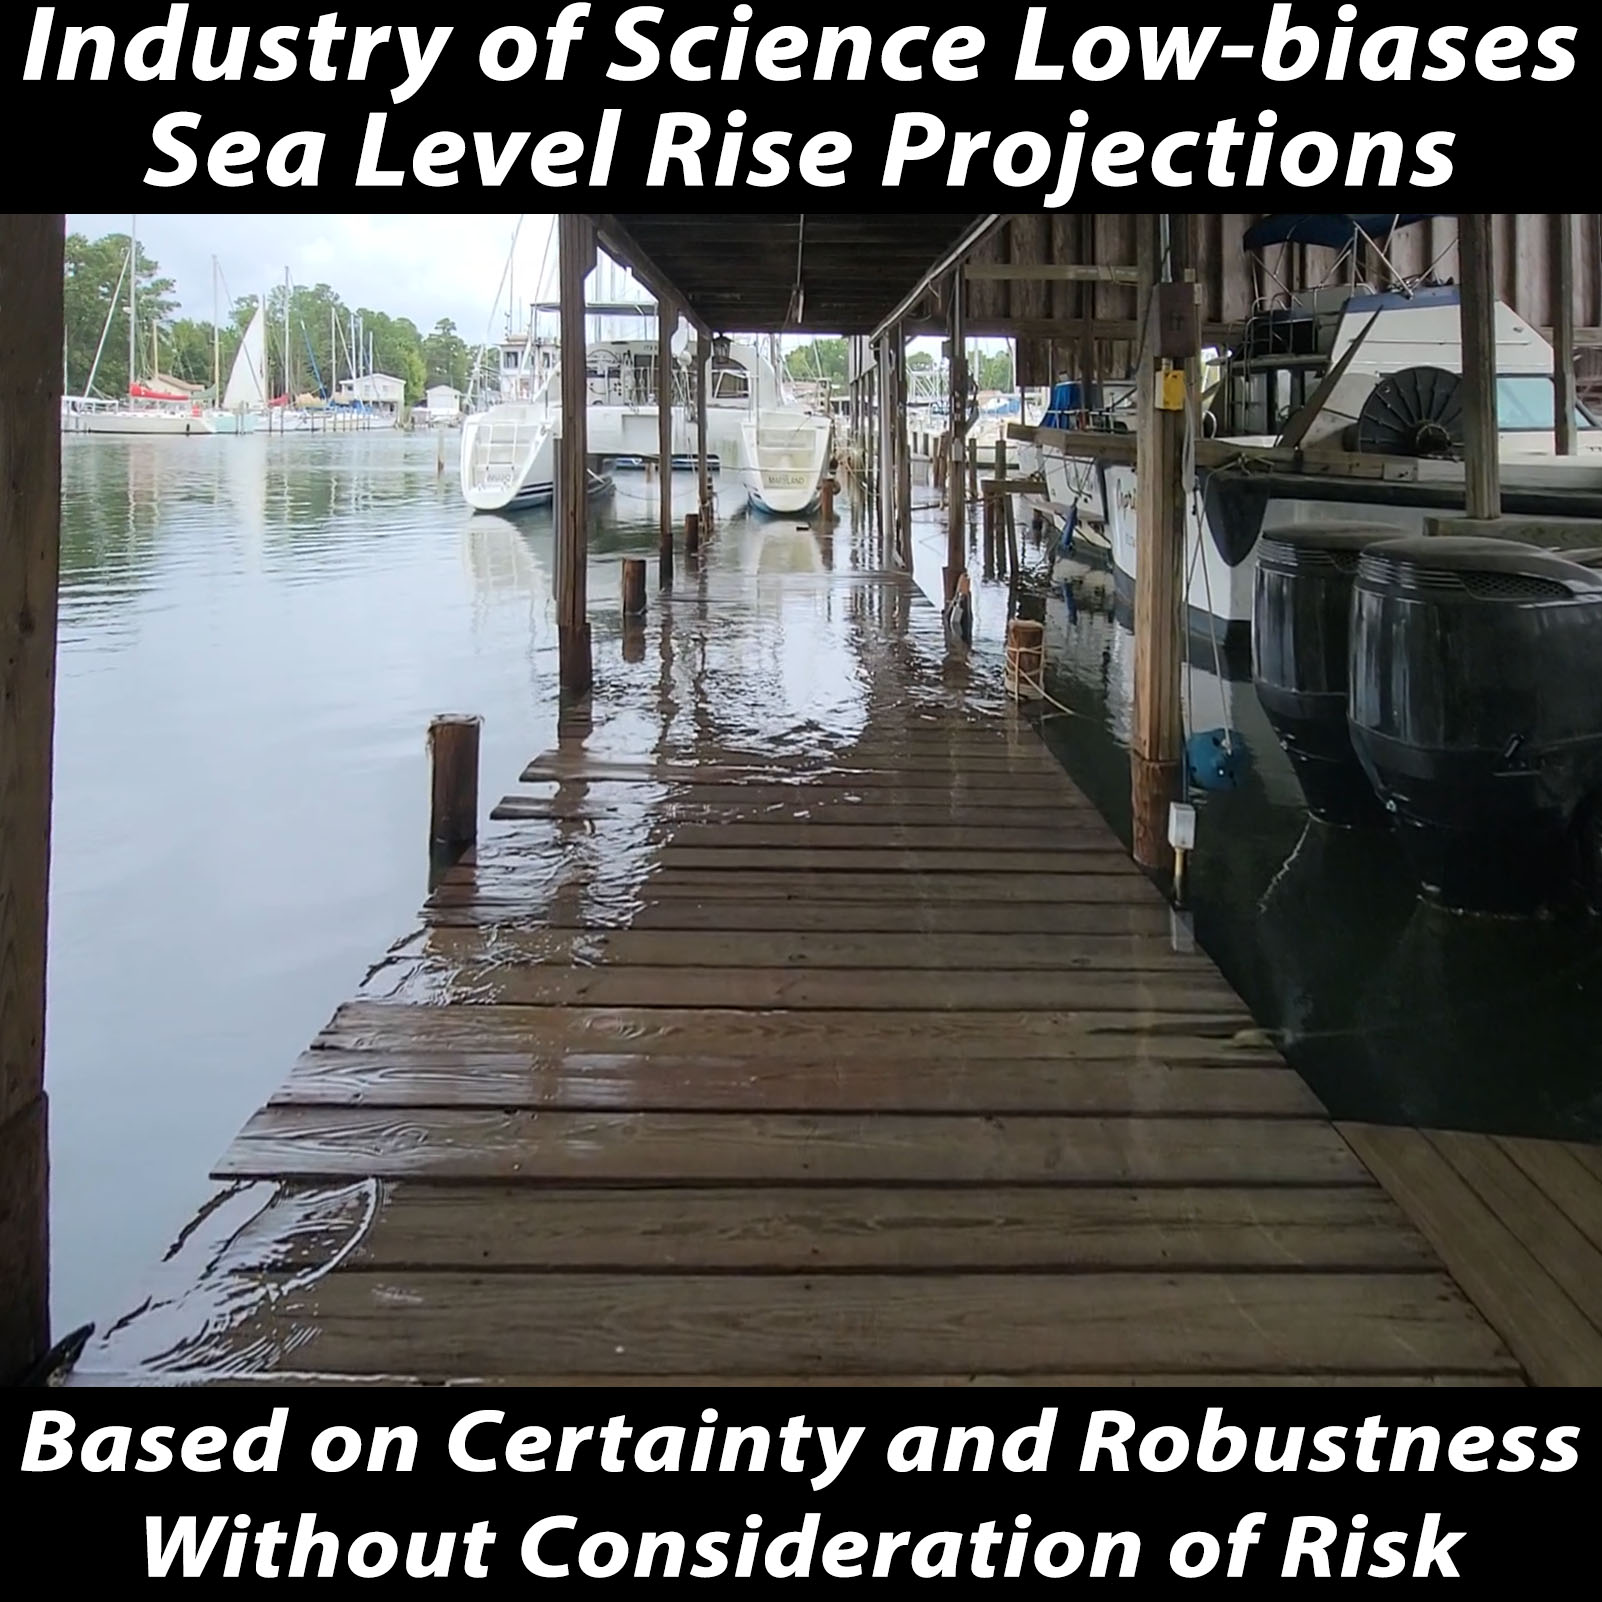
Image: King Tide, Mathews County, Virginia, Chesapeake Bay, non-storm conditions, October 2, 2024.
REFERENCES
Paleo Sea Level Rise – when SLR occurred during these paleo abrupt change warmings, there were more and larger ice sheets on Earth giving rise to greater possible sea level rise with fewer and smaller ice sheets however, forcing today is orders of magnitude greater than in paleo times nad rate-dependent change that is amplified by increased rates of change is a viable concept in understanding the rate of sea level rise form warming.
Fogwill 2017 – 52 feet in 400 years.
Fogwill et al., Antarctic ice sheet discharge driven atmospheric-ocean feedback at Last Glacial Termination, Nature Science Reports, January 5, 2017.pdf
https://www.nature.com/articles/srep39979
Hansen 2016 – 16 feet per century.
Hansen et al., Ice melt, sea level rise and superstorms…Atmospheric Chemistry and Physics, March 27, 2016.
http://www.atmos-chem-phys.net/16/3761/2016/acp-16-3761-2016.pdf
Blanchon 2011, – Up to 20 feet per century.
Blanchon, Meltwater Pulses. In: Hopley, D. (Ed), Encyclopedia of Modern Coral Reefs: Structure, form and process. Springer-Verlag Earth Science Series, p. 683-690, 2011.
https://www.academia.edu/421179/Meltwater_Pulses_Encyclopedia_of_Modern_Coral_Reefs
Deschamps 2012 =- 40 mm per year.
Deschamps et al., Ice-sheet collapse and sea-level rise at the Bolling warming 14,600 years ago, Nature, March 29, 2012.
http://www.grandkidzfuture.com/earths-climate/ewExternalFiles/meltwater%20pulse%201A%20Nature%202012.pdf
O’Leary 2013 – 20 feet per century.
Oleary et al., Ice sheet collapse following a prolonged period of stable sea level during the last interglacial, Nature Geoscience, July 28, 2013.
http://moraymo.us/wp-content/uploads/2014/04/olearyetal_natgeo_20131.pdf