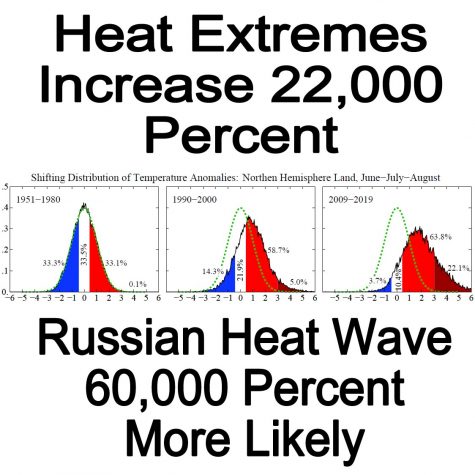


Extreme Heat Increased 22,100 Percent in Last 40 Years
James Hansen has a new post out to his big list where he shows heat extremes across Northern Hemisphere land areas have increased a mind bending 22,000 percent. Breaking down Hansen’s work, in the classic 3-standard deviation bell curve colored red, white, blue and burnt sienna with standard deviations on the bottom, and percent occurrence on the left, heat extremes that happened 0.1% of the time 1951-1980 over land in the Northern Hemisphere (burnt sienna color not visible), now happen 22.1% of the time 2009-2019 (on the right.) This is a 221 times increase or 22,100 percent.
For reference, Hansen did the same thing 2001-2011 and found that extreme heat had increased 100 times since 1951-1961. This is just another example of the nonlinear relationship between greenhouse gases and physical phenomena.

Hansen’s post: “It’s all hunky dory but…”
https://mailchi.mp/caa/its-all-hunky-dory-but?e=37ac14bbdf
2001-2011 Paper – Hansen et al., Public Perception of Climate Change, PNAS, September 12, 2012.
https://www.pnas.org/content/109/37/E2415
Heat Wave Trends Accelerate Worldwide
A paper in Nature Communications has developed a new metric to compare our warming climate to our old climate, called “cumulative heat.” This tool can be used regionally to compare local changes to the global average. Cumulative heat is defined by the authors as “when at least 3 consecutive days are above a percentile-based extreme threshold over a 5-month warm season,” or more simply put, “as the sum of the temperature anomaly relative to the respective heatwave threshold, across all heatwave days within the season,” and even more simply, it’s how many degree C a heat wave is hotter than a heat wave in our old climate.
What was found was that cumulative heat increased, “globally on average by 1°C-4.5°C each decade but in some places, like the Middle East, and parts of Africa and South America, the trend is up to 10°C a decade,” and regionally, “In Australia’s worst heatwave season, an additional 80°C of cumulative heat was experienced across the country. In Russia and the Mediterranean, their most extreme seasons baked in an additional 200°C or more.” The lead author quotes in their press release, “Not only have we seen more and longer heatwaves worldwide over the past 70 years, but this trend has markedly accelerated.”
Full Paper – Perkins-Kirkpatric and Lewis, Increasing trends in regional heatwaves, Nature, July 3, 2020.
https://www.nature.com/articles/s41467-020-16970-7.pdf
Press release at Phys.org – https://phys.org/news/2020-07-heatwave-trends-worldwide.html
Russian Heat Wave Made 600 Times More Likely – 60,000 Percent More Likely
That Russian heat weave the produced the first Siberian 100 degree temperature recently? It was made 600 times more likely because of climate change — or 60,000 percent more likely. WorldWeatherAttribution.org uses standard weather attribution procedures, or rapid weather attribution to determine if any given weather event was enhanced by or caused by climate change. This “attribution” science has been rapidly developing as more and more weather events go more and more extreme. Traditionally however, the evaluations had to go through peer review in the academic journals — a process that can take a year. WWA is using these procedures to get the word out faster, and help the public better understand the nature of climate change; before they forget about whatever weather extreme just occured. WWA partners: Environmental Change Institute, University of Oxford, Red Cross Red Crescent Climate Centre, Royal Netherlands Meteorological Institute.
https://www.worldweatherattribution.org/siberian-heatwave-of-2020-almost-impossible-without-climate-change/