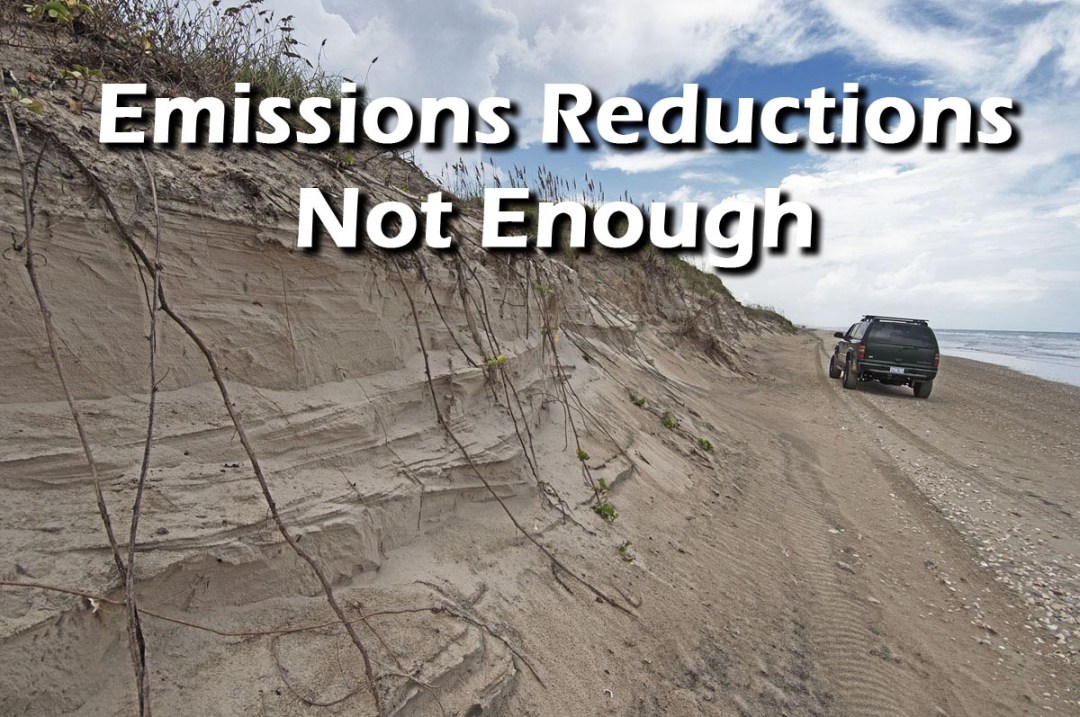

Padre Island National Seashore, 52 miles beyond the “Four-wheel Drive Only” sign. Dune erosion from normal biannual high tides — the King and Spring Tides in October and April.
NOAA’s new sea level rise report in January 2017 is a dope slap that describes 17 inches of sea level rise in Florida by 2030. You can see the report here, or check out our review that summarizes the important parts here.
The continuing publishing of sea level rise research on emissions reductions and resultant sea level rise is sobering with consistent findings showing that even fully implemented Paris Commitments allow up to five feet of sea level rise by 2100. These findings include Paris goals of 80 percent emissions reductions by 2050 and net zero CO2 emissions by 2080. New work is doubling down and raising the stakes.
- IPCC 2013 Best-case Scenario (RCP2.6) says the “likely” range of sea level rise is 10 to 22 inches by 2100…
- Mengel et al., Nature Communications, February 2018 says “likely” 15 to 21 inches by 2100 (page 3) with an important caveat…
The Caveat:
This latest article in Nature Communications (Mengel 2018) shows that even if we achieve net zero CO2 emissions much sooner than Paris (by 2040), sea level rise is very similar to what the IPCC suggested as the most likely scenario in 2013. These more aggressive scenarios include not only net zero CO2 emissions by as early as 2040, they include net zero greenhouse gas emissions (all greenhouse gases) by as early as 2040.
This caveat is really important as Paris only considers net zero CO2. Because non CO2 greenhouse gases (Methane, CFCs, HCFC, N2O, etc.) account for 36% of warming (IPCC page 678), these new findings by Mengel et al. 2018 are striking.
But sadly, all the good new science that talks about sea level rise and achieving Paris or even better than Paris emissions reductions results, does account for abrupt sea level rise. What? Why is this? NOAA is saying 17 inches in Florida by 2030 and 10 to 12 feet by 2100. (page 36) What is this cause of this disconnection?
NOAA is starting to use data from abrupt collapse of ice sheets. We have known about these events since about 2000, and even since 2008 scientists have been warning us that the West Antarctic Ice Sheet has begun its collapse. Yet, consensus science does not reflect this knowledge of abrupt sea level rise that is so dramatically higher than what is most common in the discussion and in most projections.
These abrupt jumps are 10 feet or more per century–literally five times greater than we have been told for decades. But this data is not present in projections of future sea level rise, with the exception of this new NOAA report and a very few others. The IPCC certainly has come nowhere close to this kind of projection. Why is this?
It’s because we cannot yet model these abrupt sea level jumps. We know they happened, but the modeling is as yet too complicated. Even though we are starting to get a handle on how to model these jumps (see DeConto and Pollard’s work on ice cliff collapse modeling here), because they cannot yet be robustly modeled, consensus science –like the IPCC– does not acknowledge these events except as caveats telling us that “sea level rise may be higher and faster than we project because of dynamical ice sheet collapse.”
This conundrum sounds quite counter intuitive and really it is. But it is what it is. Until we can model these jumps, or until we can incorporate more professional judgement in climate impact projections, we are stuck with consensus statements that do not meaningfully account for the obvious and real abrupt sea level jumps in our past.
The research on these past abrupt jumps is summarized and referenced in our in-depth article linked above that discusses DeConto and Pollard’s ice cliff collapse research.
So what is the takeaway from this discussion?
We see lots of new work discussing sea level rise and emissions reductions. This new work by Mengel et al., advances that work to include net zero greenhouse gas emissions by as early as 2040–including non CO2 greenhouse gases. All of this work, and all of the good outreach that goes along with it, is nowhere as meaningful as it could be because it does not include dynamical ice sheet collapse. If NOAA’s projections are valid, of up to 17 inches by 2030 and 10 to 12 feet by 2100, the resulting global economic failure will usurp any and all massive coastal inundations of low lying areas and the resultant migration of hundreds of millions of people.
The reason global economic risks are so important is the vast amount of global infrastructure located along our coasts. NOAA says that the extreme event flooding that will be evident by 2030 will have created resource abandonment that will impact 170 U.S. coastal cities by 2035 and by 2100, 670 U.S. coastal cities.
The infrastructure served by these communities — marine transportation terminals and their corresponding terrestrial transportation corridors, electrical generation utilities and electrical transmission corridors, industrial manufacturing, chemical plants and refineries that are predominantly located along our world’s coastal regions at the very edge of the sea because of transportation of raw materials, and the public works projects for water and wastewater treatment that support these communities and industry — theses critical pieces of our global infrastructure will be compromised beyond functioning.
They will be compromised if…, if we continue on a path of net zero emissions. That’s what this discussion is all about. Even if we can achieve net zero greenhouse gas emissions that include non CO2 greenhouse gases, we still continue to warm and sea level rise to increase far more rapidly than almost everyone is predicting.
The only way to feasibly reverse this trend is to go beyond net zero. Climate Change Now has been working with scientists around the country and across the globe to try and promote just this. The Healthy Climate Alliance has begun a new funding program called 300×2050 (and here) that seeks to match money with projects that can feasibly reduce atmospheric CO2 to 300 ppm by 2050. This is possible with proven negative emissions technologies that range from direct air capture of carbon dioxide to enhancement of soils and forest CO2 absorption that draws down CO2.
But this is a just astart. We still need to address 36 percent of warming caused by non CO2 greenhouse gases.