
Even the extreme rainfall we experienced with Harvey is not the new normal. As warming increases, so do extreme weather events. Importantly, a little more warming does not increase extremes a little more, it increases them a lot more because of the physics of thermodynamics. The way this physics works is that a little warming does not increase extremes a little, it increases them a lot. The new normal presented by NOAA’s new Atlas 14 does not even capture our current increase in extreme rainfall.
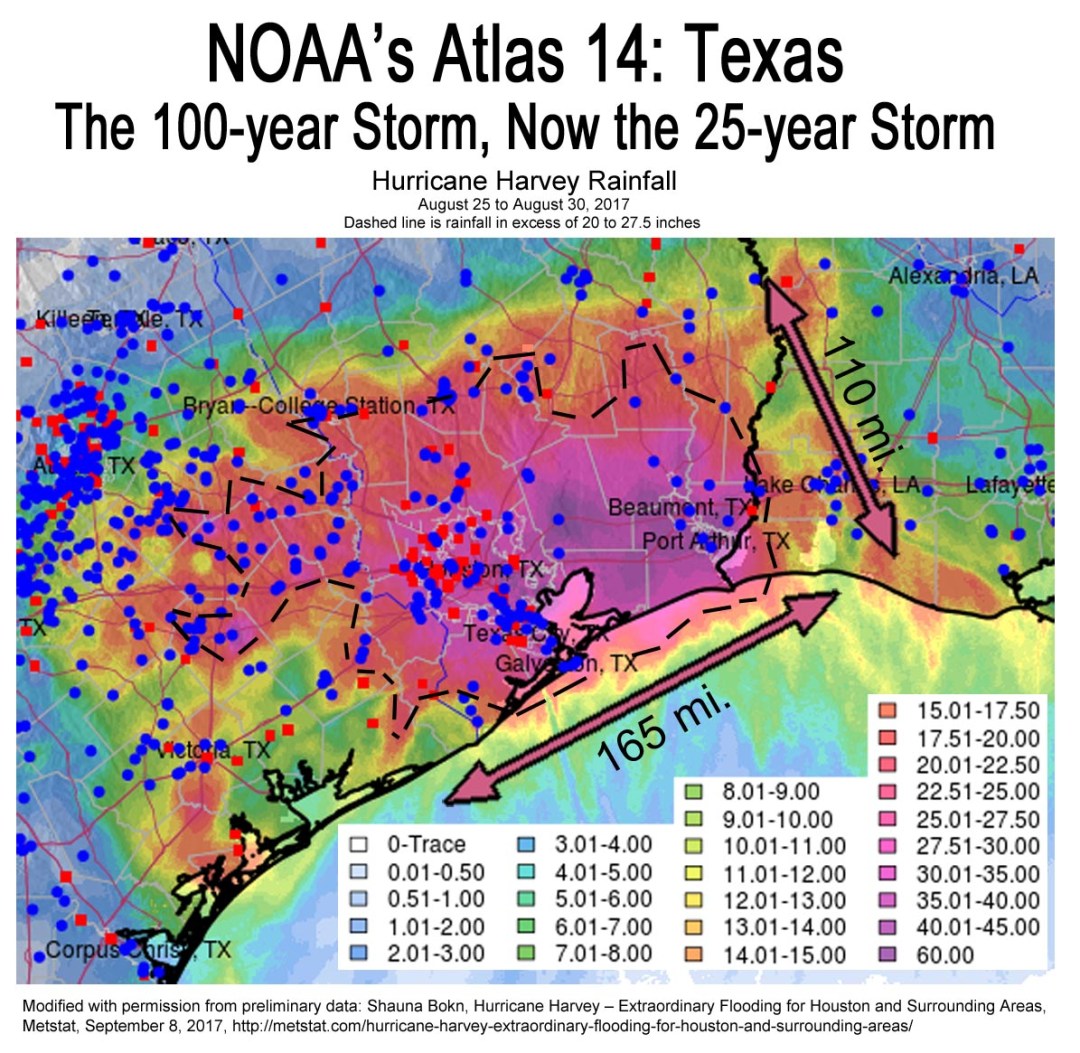
In Houston, the 100-year storm in our old climate was 12.5 inches in 24 hours. The new rainfall data analysis just released by NOAA shows the 25-year storm total is now 12.1 inches. The 100-year storm total has increased to 17.9 inches, an increase of 43 percent.
Climate scientists told us 30 years ago that weather extremes would increase on a warmer planet. But even today, the projections of exactly how much they will increase are either so vague that they are not really meaningful, or they are wildly underestimated. (See here, here, here, here, and here.)

Not the New Normal: Atlas 14, 100-year, 24-hour storm. Click for larger image.
We have the capacity to model these things, but 30 years of modeling has conclusively shown that the models badly underestimate. The confidence for this extreme event modeling is so low that it cannot be used in consensus publications upon which policy is based. These are the things that climate change deniers get correct in their misguided attempts to dismiss climate change science. Ironically, the very facts that climate deniers use to deny, are those facts that are some of the most damaging to much of our world.
For example: The 2013 Intergovernmental Panel on Climate Change Report (IPCC) tells us that by 2081 to 2100, Houston will see up to a ten percent increase in total 5-day, 20-year precipitation accumulation. (Figure 12.26, page 1083) This total 5-day precipitation for the 20-year storm in our old climate was about 11.5 inches. In Atlas 14, the depth is about 16 inches, an increase of 39 percent — already, in 2018, not 2081 to 2100: 60 to 80 years ahead of schedule and three times as much as IPCC projected.
But this badly underestimating characteristic of climate science is not the only worrisome part of the critical path of warming and how it relates to rainfall extremes. What we are seeing happening in our natural world is happening so fast that the science cannot keep up.
Scientific reasoning, like has been developed for evaluation of rainfall extremes, uses historical observations. To produce statistical confidence in historical observations, we have to have long-term records. With weather, 30 years is considered adequate to develop the confidence needed to say something is so. Less than 30 years and natural variation, or chaos in our weather, is too great to be able to make accurate statements.
This statistical thing is one of the biggest reasons why we seem to always here that “we cannot tell if this one single weather event was caused by climate change or not.” If we had 30 years to wait around before making this proclamation, enough data would have been accumulated for the statistical confidence to be high enough that we could say whether or not that extreme event was caused by climate change.
In the absence of 30 years of waiting, a new field of science has grown up called “weather event attribution.” This science uses statistics way beyond my pay grade to attempt to shorten the amount of time needed to make a proclamation of whether or not any given weather event was either caused by or enhanced by climate change. But climate science still has a lot of trouble with how much climate change has caused or enhanced a single weather event. And the widespread notion that “we just can’t tell…” makes the outreach even more difficult.
Yes we can tell. All we have to do is use common sense and logic. Climate scientists said our planet would experience more extremes when it warms. It’s warmed.
Using Hurricane Harvey as an example, numerous climate scientists and a few academic works have helped us understand the reasons why warming enhances hurricane extremeness, but pinning down exact amounts is another question entirely. We have found with Harvey that many things increased the flooding experienced in that storm including: increased water temperature that drives the heat engine of a hurricane; increased depth of warmer water where hurricanes once churned up cooler water that diminished hurricane strength, those waters are not near so cool any more; increased air temperature that increases the amount of moisture the air can hold and thus rain out; increased sea level that increases the amount of flooding from storm tides and decreases the amount of rainfall runoff that can flow into the ocean; and decrease in the strength of steering current winds, both modeled in a warmer climate and now observed as actually occurring, where the decreased steering currents allow storms to stall out longer than in our old climate.
And we have to be careful of how we read the popular press reporting these attribution findings. Using Hurricane Harvey as an example again, widespread reporting said that “record” ocean temperatures were one of the reasons Harvey was enhanced by climate change. What they don’t say is how our brains react to the discussion of “record temperatures.”
In our old climate, a record weather extreme was a relatively rare event. As individuals, we would experience a temperature record within our sphere of existence on the television weather report, a few to several times a year. Today however, these records are happening much more often. In the U.S. is the last 365 days there were 2.13 new record high temperatures for every 1 new record low temperature. In a stable climate, this ratio would be 1 to 1. In the 1950s, the ratio was 1.09 to 1.
The other thing about today’s record ocean temperature for example is that almost every year sets a new record. Our old understanding of what “record ocean temperature” means is just not valid any more. The record ocean temperatures that Harvey encountered are now normal. But it’s not the “new normal.” Every year it gets warmer. Tomorrow’s “normal” will be warmer than today’s.
So Atlas 14 is a very useful tool. It tells us that rainfall has indeed increased a lot already, it’s not just our imaginations or natural cycles. But on a warmer world, a little more warming does not create a little more extremeness. Thermodynamics are at play. A little warming creates a lot more dynamic response, meaning that a little more warming does not create a little more extremeness, it creates a lot more.
NOAA 5-day Precipitation Atlas
TP40: Our Old Climate’s Precipitation Analysis