by Bruce Melton
Climate Change Now Initiative, 501c3

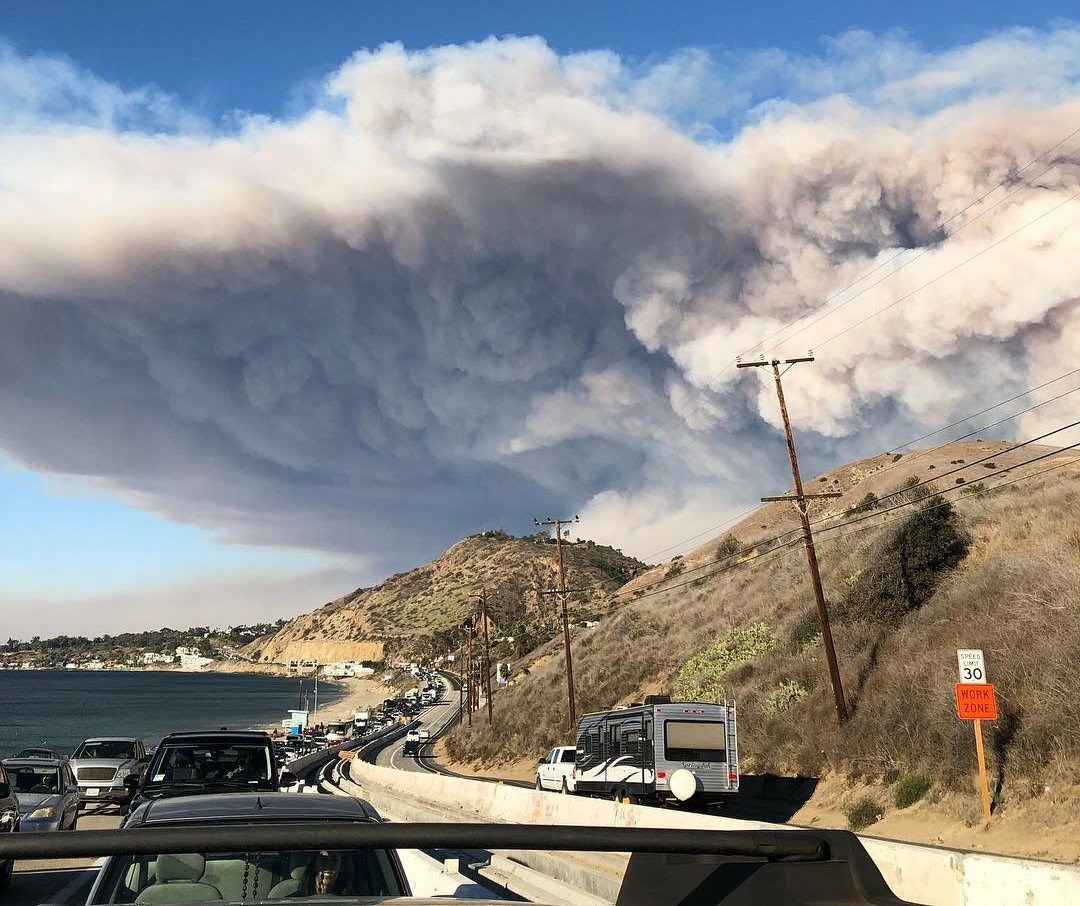
The Woolsey Fire Evacuation, November 9, 2018, Malibu, California. Unprecedented catastrophes increase in extremeness nonlinearly with further warming. Photo by Cyclonebiskit, Wikimedia-Commons
So much happened in our climate change world in 2018 that we are printing this article in two parts: The Bad, and The Good. We start with the bad, and as bad as it was it is utterly fascinating that these things are actually happening on Earth today. There is a lot of really good news to report from 2018, but in this first part we will focus on events of 2018 that show how far advanced climate change already is, so that we can learn from them to make our future a safer place.
The latest climate change mega reports are as unprecedented as are the fires and US leadership anti-climate science and regulatory rollback actions. Two billion dollars have been spent on lobbying against climate change action in Congress during the period 2000 to 2016. US national forests are dying at a rate that is twice as fast as they are growing. Mileage standards have been scrapped. Methane rules obliterated. Alaska has flipped from a carbon sink to a carbon source because of permafrost melt, and more.
Because further warming increases impacts nonlinearly, we have a heavy load to tow. Below is a list of topics covered in this article:
Trumps War on Climate
The Fracking Mess
Auto Emissions Standards Rollback
EPA Intent on Decreasing Science Transparency
$2 Billion Spent on Anti-Climate Lobbying 2000 to 2016
National Climate Assessment Review
IPCC 1.5 C Report Understatements
Required Carbon Dioxide Removal and Natural Earth Systems
– IPCC
– National Academy of Sciences
– Paul Hawken’s Drawdown
– Dicaprio’s One Earth Climate Model
– Hansen on Plausible Natural Carbon Dioxide Removal
Alaska Flips from Carbon Sink to Carbon Source From Permafrost Melt
California Fires – The Pyrocene
The 100-year Storm is Now the 25-Year Storm

Portrait of president He Who Shall Not be Named. Melody Clifford, Age 8, with permission.
Trump’s War on Climate
The Trump environmental news was so bad in 2017, it’s hard to say how bad it was in 2018. To get a complete look at the astonishing Trump environmental rollbacks see Columbia, Harvard, National Geographic, Union of Concerned Scientists or Brookings. Some of his rollbacks are special. We discuss them below:
The Fracking Mess: Methane, Health and Air Quality
Cheap fracked gas has reduced CO2 emissions, but not the increase in pollution from methane and other toxics. When up to 15,000 pounds of pressure is released from the fracking process, some of the natural gas (and other toxic gases) in the ground escapes as fugitive emissions and is not required to be captured. Up to four to eight percent of a well’s total lifetime production can be released in this short burst of fugitive emissions that has historically been uncontrolled like the “gushers” we know from the early days of oil exploration.
Rollback of methane emissions rules from 2016 is under way that would have strictly limited methane and toxic chemical releases from fracking. Methane, or natural gas, has a warming potential that is up to 100 times greater than carbon dioxide in the short-term time frame that is so important to consider when thinking in terms of abrupt climate changes.
An Environmental Working Group report from March 2018 says, “Not only do existing fracking regulations fail to protect Americans from increased risk of cancer, asthma and birth defects, but there is no evidence fracking can ever be done without threatening public health.” These rules being rolled back would have also limited very large releases of smog forming compounds common in oil and gas extraction.
Stanford research in June 2018 says fugitive emissions from all of the natural gas industry in the US are 60 percent more than EPA estimates representing $2 billion worth of product.
Rollback of Auto Emissions Standards
In an April 2018 press release, then-EPA administrator Scott Pruitt announced that the US government would revisit the Obama administration’s fuel efficiency standards for cars and light-duty trucks—the first step in a rollback of one of the US’s biggest efforts to curb carbon emissions. In July 2011, President Obama announced he would tighten average fuel efficiencies equivalent to 54.5 miles per gallon (mpg) by model year 2025. Trump’s proposal is for 37.5 mpg.
Eighteen states have vowed to fight the rollback. The New York Times has reported that letters sent to Republican lawmakers in a campaign by Marathon Petroleum over the summer said, with oil scarcity no longer a concern, Americans should be given the choice in vehicles that best fit their needs. See The Hill too.
About a sixth of US greenhouse gas emissions in 2016 came from passenger cars and light-duty trucks. Overall, by 2025 the Obama program would have saved consumers $1.7 trillion and reduced greenhouse gas emissions by 6 billion metric tons —more than the total US CO2 emissions in 2017.
EPA Intent on Decreasing Transparency in Science
Environmental Protection Agency Administrator Scott Pruitt proposed a rule in April that would limit data to scientific studies for which the underlying data are made available publicly. This rule could reduce the EPA’s ability to consider all the evidence available when making rules on tough questions like power plant emissions and the safety of everything from pesticides to consumer products.
Under this proposal that was stunningly labelled “Strengthening Transparency in Regulatory Science“, most large-scale medical studies would be banned when creating rules about air pollution, toxic chemicals, and water contaminants.
What have we learned from the actions of He Who Shall Not Be Named?
If anything good comes out of this mess, it’s that we now have a greater understanding of the value of environmental regulations, and that these regulations are not static. The more we learn and advance as a society, the more we find out about new things that are detrimental to us, our children and our way of life. As new technologies emerge, and as we gain a better understanding of risks, it is imperative that we stand up for our rights to protect and preserve.

Some things don’t change. This lobbying cartoon was created by Joseph Keppler in 1889. From Climatic Change, doi:10.1007/s10584-018-2241-z
Nearly $2 Billion Spent on Anti-Climate Science Lobbying From 2000 to 2016
Data for the latest research on anti-climate lobbying from Drexel University’s Professor of Sociology and Environmental Science Robert Brulle, comes from the 1995 Lobbying and Disclosure Act. About $2.08 billion (in 2016 dollars) was spent on climate lobbying between 2000 and 2016. This is about 3.9 percent of total lobbying dollars spent of $53.5 billion. The breakdown is: electrical generation – 26 percent, fossil fuels 17.7 percent, and transportation 12.1 percent. The research also identified 231 different organizational types that do not fit into standard categories.
Brulle says that the “spending of environmental groups and the renewable energy sector is dwarfed by the spending of the electrical utilities, fossil fuel, and transportation sectors.” Lobbying expenditures from 2000 to 2016 from environmental and renewable energy groups amounted to only five to seven percent of the total.
The Take Away?
The bottom line is that today’s political situation in the US is dangerous to the world. Supporting our new blue wave elected officials is only the start. We have to ensure 2020 brings a blue tsunami and to do this we have to start now. One of the best strategies is to join a group like Indivisible.
The Indivisible movement began with a plan to lobby for change after the 2016 election. The plan was written for civilians, to teach them the most effective ways to encourage our elected leaders to behave in the best interests of their constituents.
Indivisible now has a new plan that seeks to set the agenda for action after the 2020 blue tsunami. Time is precious. Once the blue tsunami is realized in 2020, we need to be able to hit the ground running. By encouraging our elected officials to set the agenda today, we will save time and lives in 2021.
National Climate Assessment Understatements
The National Climate Assessment (NCA) tells us that, “without adaptation, cumulative damages to coastal property across the contiguous United States could reach $3.6 trillion through 2100, compared to $820 billion in the scenario where cost‐effective adaptation measures are implemented.” But the NCA heavily weights impacts for sea level rise of only up to of three feet by 2100. This significantly diminishes the importance of the 2017 National Oceanic and Atmospheric Administration (NOAA) worst-case scenario of 8.2 feet by 2100.
In addition, the $3.6 trillion estimate is discounted at three percent, which means that the future value is less than today’s dollars because of inflation. When today’s dollars are considered, we see $900 billion in damages every 10 years, or $7.2 trillion in damages by 2100 in 2015 dollars, for three feet of sea level rise. (Figure 15.1, page 115) But three feet of sea level rise by 2100 is consistently seen as low today.
The National Oceanic and Atmospheric Administration’s Margaret Davidson (now deceased,) said in April 2016 that data collected but not yet published shows 10 feet of sea level rise by mid-century, a substantial component coming from collapse of the West Antarctic Ice Sheet.
Prehistoric sea level rise from ice sheet collapse can be as much as 10 to 20 feet per century. (see here, here and here.) The capacity of Earth to raise sea level must not be underestimated especially considering that today we are warming our world far faster than almost anything in prehistory.
This discrepancy between prehistoric sea level rise and current projections is a huge challenge for science as abrupt Earth systems changes (such as ice sheet collapse) are not significantly included in future climate projections. This is because we cannot yet model abrupt ice sheet collapse with any degree of certainty, as explained by 19 researchers in a November article in Nature Climate Change, “The Greenland and Antarctic ice sheets under 1.5 C global warming.”
Contrast NCA’s cost impacts with more realistic work in Environmental Research Letters in 2018 that shows $27 trillion per year coastal impacts globally under a worst-case sea level rise scenario of 6.2 feet by 2100.


Another understatement in the NCA is 100-degree days. In Austin Texas, the NCA shows an increase of 30 to 50 additional annual days of 100 degree plus heat by 2070–2099 as compared to 1976–2005. (Figure 23.4) But in Austin already, NOAA’s National Climatic Data Center temperature data shows 100 degree days have increased from 10.5 per year 1900 to 1990 to 38 averaged over the last ten years. This is an increase of 28 days, already.
Intergovernmental Panel on Climate Change (IPCC) 1.5 C Report
On October 8, the IPCC released a new report that defines the new limit to dangerous warming of 1.5 C, or at least describes the difference between 2 C and 1.5 C warming. Many think this resets the goal posts for 2019 and beyond. In reality, it’s just a good start.
The report was filled with astonishing projections of post apocalyptic climate change that will only increase in 2019 and beyond if we continue to warm. Two things stand out: We are on a pathway to greater than 3 C of warming right now. To limit warming to 1.5 C, IPCC says we need to reduce emissions 20 years faster than their previous work from 2013, with 80 percent reduction by 2030 and 100 percent (net zero) by 2050. Second, we must also remove very large amounts of accumulated CO2 from our sky.
To limit warming to 1.5 C by 2100, (with warming to 1.8 C pre-2100 while we implement climate pollution reforms) the report says that in addition to net zero emissions by 2050, we need 1,000 gigatons (gt) CO2 removal from the atmosphere (Figure 2.13, c). This averages out to 12.5 gt per year 2020 to 2100.
Strong questions arise in the report about how to achieve this atmospheric carbon dioxide removal in Section 2.3.4.2 Sustainability implications of CDR deployment in 1.5°C. These questions are relevant to how we get this 12.5 gt annual carbon dioxide removal with natural CO2 removal from oceans, forest and agriculture, and their sustainability. Section 4.3.7 Carbon Dioxide Removal (CDR) details the challenges. More discussion is below.
Required Carbon Dioxide Removal (CDR) and Plausible Gigatons from Natural Earth Systems
A growing body of work has revealed the amount of carbon dioxide removal needed to achieve the 1.5 C goal and the plausible contribution from natural Earth systems like forests, soils, agriculture, and oceans. There’s a range as usual, from 2.75 to 10 gt per year, for 1.5 C by 2050 to 2100, with and without overshoot to about 1.8 C before 2100. One of the important challenges with using natural systems to remove CO2 is that it requires conversion of land needed for growing food to land used to remove CO2 from the air. The lower estimates of CDR needed are generally more sensitive to social, economic and environmental impacts of these CDR strategies.
It is very important to note that the work in this section and all current work on CDR, dors not evaluated pathways less than 1.5 C. These 1.5 C scenarios allow additional warming, which allows weather catastrophes to increase, and plausibly allows abrupt Earth systems collapses to complete their unrecoverable and irreversible collapse initiations. Providing a safe and healthy climate would mean the warming goal needs to be less than the temperature that allowed these catastrophes and collapses to begin, which is significantly less than the temperature today of about 1 C above preindustrial.
The IPCC 1.5 C Report Table 2.4 , tells us that holding the global temperature to 1.5 C by 2100 with overshoot to between 1.7 and 1.8 C, requires 4.4 gt negative CO2 emissions per year from agriculture, forestry and other land uses, plus 5.7 gt negative CO2 emissions from bio-energy with carbon capture and storage (BECCS), for a total of 10.1 gt negative CO2 emissions per year through 2100.
The plausible CDR from IPCC’s 1.5 C report, taking the mid-points from forest, soils and agricultural practices, is 5.8 gt per year. The IPCC does not do a very good job of using judgment to report probable amounts however. What they do is list all of the available publishing which produces some very large ranges with low confidence in areas where little work has been done.
For example, the IPCC BECCS estimated CDR potential is 0.5 to 5 gt per year (2.75 gt average,) requiring 25–46% of arable and permanent crop area in 2100; Aforestation and reforestation have the potential of 0.5 to 3.6 Gt per year (2.0 gt average); Soil carbon sequestration with agriculture strategies and biochar are 2.3 to 5.3 gt per year (3.8 gt average). For enhanced weathering of minerals, ocean alkalinization, and ocean fertilization, IPCC says low evidence and low confidence with a wide range of values from less than 1 gt to 95 gt per year. These ocean and mineralization strategies do not include (much) work on socio, economic and environmental risks.
Direct air capture of carbon dioxide with chemicals is presented with an equally large range of $20 to $1,000 per gt and no estimate of the plausible CDR quantity. The challenge with direct air capture is that the current industrial scale trials are not represented in the literature because 1) the private organizations involved are protecting their trade secrets, and 2) this work does not include the 2018 David Keith paper on Carbon Engineering’s $100 per ton existing process. (See Part 2 of this series, Atmospheric Carbon Dioxide Removal (CDR) Costs Plummet – Drawdown: Negative Emissions.)

The National Academy of Sciences Negative Emissions Technologies Report in 2018 says the safe, equitable atmospheric carbon dioxide removal with natural terrestrial Earth Systems enhancements is 2.75 gt CO2 per year globally. (Table 1) The Report Highlights states that up to 5 gt atmospheric CO2 removal using forests and agriculture enhancements is plausible, “However, attaining these levels would require unprecedented rates of adoption of agricultural soil conservation practices, forestry management practices, and waste biomass capture. Practically achievable limits are likely substantially less, perhaps half the 1 GtCO2/yr in the US and 10 GtCO2/yr globally.” When this logic is applied to the quantities in Table 1, the results are that half of 5.5 gt atmospheric removal are available. The description of Table 1 states, “The ‘Safe’ rate of CO2 removal means that the deployment would not cause large potential adverse societal, economic, and environmental impacts.”
IPCC says additional CDR from BECCS and blue carbon (living plants or sediments in tidal marshlands, seagrass beds, and other tidal or salt-water wetlands) of 2.15 Gt CO2 per year is possible globally. The total “safe” CDR from natural sources is then about 4.9 gt CO2. The rest must come from technologies for CDR, that use chemical and mechanical means, or oceans, otherwise we exceed 1.5 C goals.
Dicaprio’s One Earth Climate Model has identified 159 gt CDR by 2050 is plausible, or 5.3 gt per year to limit warming to 1.5 C by 2050. It includes marine and terrestrial conservation, reforestation, and carbon-negative agricultural practices. From their press release, “Citing a growing body of research, we show that using land restoration efforts to meet negative emissions requirements, along with a transition to 100% renewable energy by 2050, gives the world a good chance of staying below the 1.5°C target.” The details are yet to be published, so it is unclear to what extent this work considers socio, economic and environmental implications, and what level of temperature overshoot is reached while we implement solutions.
This section would not be complete without addressing one of the authoritative estimates of plausibly safe natural systems CDR in 2017. This is from James Hansen, former director of NASA’s Goddard Institute for Space Studies. His “Young people’s burden: requirement of negative CO2 emissions” suggests that 367 gigatons CO2 is an appropriately ambitious target for forests, soils and agriculture carbon dioxide removal by 2100. The other two-thirds of the 1,000 gt CDR – in addition to halting all CO2 emissions by mid-century – must come from other means like or direct air capture or geoengineering strategies like ocean fertilization, bioenergy with carbon capture and storage (BECCS), and biochar.

Table 2 – Drawdown, Paul Hawken: Plausible carbon dioxide removal with natural Earth systems. Graph assembled from Hawken data by Bruce Melton.
Paul Hawken’s Drawdown presents another estimate of the plausible CDR from 2017 that needs to be mentioned for forests, soils and agriculture. (Table 2) Hawken suggests enhanced natural CDR of 10 gt CO2 per year. Arguably, the strategies put forth by Hawken are fairly exhaustive and advanced. A reasonable goal based on Hawken’s work would be some amount that is 10 gt or less.
What have we learned from these mega bad mega reports?
The safe limit to warming has effectively been lowered to 1.5 C. This limit however, does not take into consideration abrupt Earth systems changes (Ice sheet collapse, arctic sea ice collapse, Gulf Stream shutdown, temperate and tropical forest collapse, permafrost collapse, etc.,) because they are not yet modelable and therefore are not evaluated. This is an extraordinary limit to climate science and is one the reasons that we are seeing these astounding catastrophes happening far ahead of projections.
Just taking these two mega reports at their word, to limit warming to 1.5 C at 2100 with overshoot to 1.8 C while we get our greenhouse gas pollution reform solutions underway, we need to reduce emissions 80 percent by 2030, 100 percent by 2050, remove as much CO2 from the air as we can with natural solutions, and significantly more CDR using climate pollution treatment technology.
Another very important revelation is that even with net zero by 2050, and 12.5 gt atmospheric CO2 removal per year, we still warm to 1.8 C, with the temperature falling to 1.5 C at 2100. This leaves us warmer than we are today for well in excess of the next 100 years.
To stop the catastrophes and to stop the abrupt Earth systems collapses that have already been initiated, the global temperature needs to be much lower than it is today. After all, these things started a decade or more ago, when warming was about 0.5 C.
To lower Earth’s temperature, we must reduce emissions as fast as possible, and remove far more than 12.5 gt CO2 from the sky every year. We can do this. We will present the technology, first used in submarines to keep our sailors safe from carbon dioxide poisoning in World War II, in part 2 of this discussion.

Permafrost melt on the Glenn Highway, Alaska, 2018. This was a rare site a decade ago and is relatively common in 2018. Photo by Bruce Melton
Alaska Flips from Carbon Sink to Carbon Source because of Permafrost Melt
Alaskan permafrost melt is now emitting more greenhouse gases than the entire state is storing in tundra and forests ecosystems according to findings in the Proceedings of the National Academy of Sciences. This wasn’t supposed to happen before the end of the century and Trump’s plans to open the 19 million acre Arctic National Wildlife Refuge to oil drilling will only make things worse.
Alaska’s flip began in 2012 and emissions of greenhouse gases statewide were 24, 249 and 117 megatons of CO2 in 2012 -2014. For reference in 2013, the state of Florida emitted a little over 200 megatons of CO2.
The authors tell us: “Long-term records of soil temperature within permafrost increased by nearly 2 °C at a depth of 33 to 50 feet near Barrow, Alaska since 1950.” This is deep warming and critical to overall permafrost melt that can be hundreds to thousands of feet deep. At Barrow Station along the Arctic Ocean, October through December emissions of CO2 from surrounding tundra increased by 73% since 1975.

Horseshoe Lake, Banff National Park, Canada, 2018. Scenes like this from the summer of 2018 are astonishingly common across the North American West. Native beetles have destroyed large parts of 96 million acres in the North American West since the turn of the century, an area the size of New England, New York and New Jersey combined. Photo by Bruce Melton
US National Forests: Mortality Exceeds Growth by 2:1
Because of unprecedented beetle kill, fires, disease, and plain old drought, our nation’s forests are dying faster than they are regenerating. This is something that is not projected in climate impacts, except in very vague terms about distant future ecosystem transformation, and it was memorialized in May 2018 by Forest to Market’s Market Watch. This analysis shows that in 2016, forest growth was only 48 percent of mortality. About 6.3 billion dead trees were standing in 11 western states in 2015.
The base data comes from the US Forest Service and shows that twice as many trees are dying as are growing across US national forests. Academic work on net carbon sequestration is not published yet, but the simple logic behind our forests dying faster than they can regenerate tells us that our nation’s national forests are (likely) no longer absorbing greenhouse gases, they are emitting them.
For our future, this information has exceedingly important meaning. If we are planning on our forests to absorb a substantial amount of CO2, and we are, understanding that forest health is already so compromised is vitally important to future climate policy.

Trail Mountain Fire, Utah, 2018. US Forest Service.
California Fires – The Pyrocene
This is not the new normal. As we continue to warm, horrific fires will only grow worse, and they will do so like our climate changes – nonlinearly, like an avalanche. (see here) At least 86 deaths were reported in the November 2018 Camp Fire in Paradise, California.
The Camp Fire spread to 20,000 acres in the first four hours 15 minutes and to 55,000 acres in 11 and a half hours traveling a total of 17 miles in half a day.
The October 8, 2017 Tubbs Fire in Santa Rosa set the last record for structures destroyed at 5,643, until the Camp Fire in Paradise in November 2018 saw 18,804 structures destroyed.
The largest wildfire in California history was the Thomas fire in December 2017 that burned 282,000 acres, until 2018 when the Mendocino Complex Fire burned 459,000 acres.
The University of California, Irvine, says the occurrence of extremely large Santa Ana (wind-caused) fires has increased abruptly since 2003, and Santa Ana winds storms are now unprecedented in the modern record. Researchers from the University of Oklahoma and University of Idaho say (in California) it’s warmer than ever recorded, it was the driest March through October ever recorded, fuel moisture was the driest ever recorded, and fire weather was the most acute since fire weather forecasting began 20 years ago. The director of the California Department of Forestry and Fire Protection (Cal Fire) says fire season is now year-round, making drying more severe than ever before.
Area burned in California has doubled since 2003, but the number of fires hasn’t changed. Costs of fire suppression in California has increased nearly 180 percent since 2003, nearly fifty percent more than the doubling of area burned.

Barker Flood Control Reservoir, Hurricane Harvey 2017. Though the new National Oceanic and Atmospheric Administration (NOAA) Atlas 14 tells us the 100-year storm is now the 25-year storm for over 12 million Texans. Photo from NOAA Atlas 14 press release.
The 100-year Storm is Now the 25-year Storm Across a Large Swath of Texas
NOAA has released their new infrastructure design and flood risk management criteria for Texas with publication of Atlas 14 in September 2018. This latest evaluation of rainfall in Texas says the old 100-year storm is now the 25-year storm.
The trouble is, this is an understatement because it is based on long-term rainfall changes. Because rainfall extremes have only begun their dramatic increases recently, the trend is averaged low. This is a challenge with IPCC reporting too.
The IPCC 2013 report says Houston will see up to a ten percent increase in total 5-day, 20-year precipitation accumulation by 2100. The Atlas 14 total is already, in 2018, 60 to 80 years ahead of schedule and three times as much as IPCC projected, and Atlas 14 is understated because of long-term averaging.
Research by Kerry Emanuel at the Massachusetts Institute of Technology may give us a truly important look into the future. They have used new modeling methods to simulate Harvey-like storms. Today, in our already changed and dangerous climate, Harvey-like storms will recur in Houston on average every 16 years. By 2100, they will happen every 5.5 years.
Final Statement
Take heart. We know more now than we new in 2017. This helps us guide policy changes to update and adapt to our new climate changed world. And, there is a lot of good news in Part 2 of this article.