
Why are climate change impacts so much worse than projected? What does it mean? Why don’t we do something? In a nutshell, science is conservative, it’s slow, and the great climate consensus that has evolved to protect our society compounds the understating nature of the industry of science. This creates a vastly understating public facing message.
Traditional policy creation then draws upon consensus science and public opinion in a compromise. All of this is then delivered back to the public through a “fairness lens” that presents both sides of the story equally, without regard to scientific veracity, reducing the level of public concern more, and compromising policy content more.
This all leads to a greater belief in the perceived debate, which manifests in public distrust of climate scientists. This distrust itself then feeds back into the policy loop and it has done so in such a profound way that public perception that allows proposed policy to become law, does not significantly resemble the realities of climate science and impacts already happening.
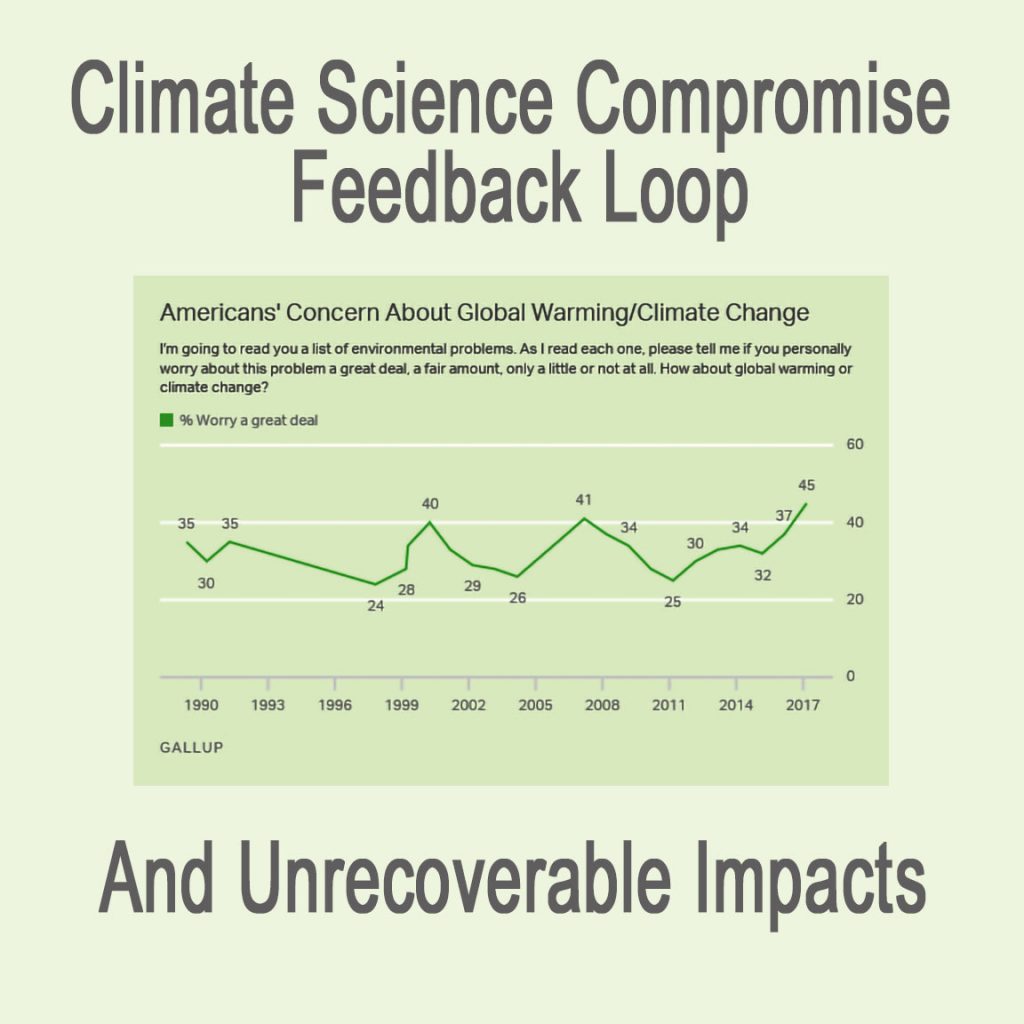
Below are some polling graphics that show the compromised state of public understanding of climate science today. Below these graphics are critical climate impacts happening far ahead of schedule; that because of the perceived debate, understating science, distrust of climate scientists, and the fairness lens of the media, are simply unknown in almost all of our society today.
When just the actual impacts happening today are juxtaposed against public perception, It’s easy to see how significantly this climate science compromise feedback has become.
America’s concern over climate change has hardly changed in thirty years. Considering the grave nature of impacts already occurring far ahead of schedule, and how significantly impacts have increased since the run of the century, concern is but a shadow of what it should be and in now way tracks increasing impacts. Even now, with our current antiscience leader, awareness is only slightly higher than the 30-year peak. It would be comforting to think concern has grown since 2017, but it has not.
We can only hope that the recent spate of apocalyptic climate science reports and the vastly unprecedented fires and floods will have made an impact on public awareness in the coming polls.
The deal is, the public simply does not know what is going on with climate change. Reality is obfuscated by the perceived debate’s tired suggestion that science does not know for sure. If we could only communicate the real science without the fairness lens of the media, we could end the climate science compromise feedback loop and the real science would be known. From this point we could then create policy that would address the future appropriately.
Below is a short list of some of the most important impacts happening today, that because of the climate science compromise feedback loop, the vast majority of the general public have no idea are occurring:
Commane et al., Carbon dioxide sources from Alaska driven by increasing early winter respiration from Arctic Tundra, PNAS May 23, 2017.
https://www.pnas.org/content/pnas/114/21/5361.full.pdf
https://agupubs.onlinelibrary.wiley.com/doi/full/10.1002/2015GB005133 Yang et al. 2018, say that the 2005 Amazon drought continued to create carbon emissions through 2008 of 1.1 gigatons CO2 per year.
Yang et al., Post-drought decline of the Amazon carbon sink, Nature, August 9, 2018.
https://www.nature.com/articles/s41467-018-05668-6
2016 Drought: (Abstract) Tropical and sub-tropical South America are highly susceptible to extreme droughts. Recent events include two droughts (2005 and 2010) exceeding the 100-year return value in the Amazon and recurrent extreme droughts in the Nordeste region, with profound eco-hydrological and socioeconomic impacts. In 2015–2016, both regions were hit by another drought. Here, we show that the severity of the 2015–2016 drought (“2016 drought” hereafter) is unprecedented based on multiple precipitation products (since 1900), satellite-derived data on terrestrial water storage (since 2002) and two vegetation indices (since 2004). The ecohydrological consequences from the 2016 drought are more severe and extensive than the 2005 and 2010 droughts. Empirical relationships between rainfall and sea surface temperatures (SSTs) over the tropical Pacific and Atlantic are used to assess the role of tropical oceanic variability in the observed precipitation anomalies. Our results indicate that warmer-than-usual SSTs in the Tropical Pacific (including El Niño events) and Atlantic were the main drivers of extreme droughts in South America, but are unable to explain the severity of the 2016 observed rainfall deficits for a substantial portion of the Amazonia and Nordeste regions. This strongly suggests potential contribution of nonoceanic factors (e.g., land cover change and CO2-induced warming) to the 2016 drought.
Erfanian et al., Unprecedented drought over tropical South America in 2016 significantly under-predicted by tropical SST, Nature scientific Reports, July 19, 2017.
https://www.ncbi.nlm.nih.gov/pmc/articles/PMC5517600/
McCarthy et al., Observed interannual variability of the Atlantic meridional overturning circulation at 26.5N, Geophysical Research Letters 2012.
https://agupubs.onlinelibrary.wiley.com/doi/epdf/10.1029/2012GL052933Global warming “hole” the key to this new research… This warming hole is caused by melt from Greenland and transport of low saline waters from arctic sea ice decline. These waters are pooling in the northwest Atlantic and inhibiting Gulf Stream flow northward via the Atlantic meridional overturning circulation (AMOC) Rhamstorf et al state, “Weakness [of the AMOC] after 1975 is an unprecedented event in the past millennium. Further melting of Greenland in the coming decades could contribute to further weakening of the AMOC.”
Rhamstorf et al., Exceptional 20th century slowdown in Atlantic Ocean overturning circulation, Nature Climate Change, March 23, 2015.
http://www.meteo.psu.edu/holocene/public_html/Mann/articles/articles/RahmstorfEtAl_NatureCC15.pdfSlowed 7 percent per year, 2004 to 2012 about 40 percent… Based on the Atlantic buoy system: RAPID-Meridional Overturning Circulation and Heatflux Array, there was a +/- 40 percent reduction in Gulf Stream flow as the authors state, “The increased southward flow of warm waters is balanced by a decrease in the southward flow of lower North Atlantic deep water below 3000 m. The transport of lower North Atlantic deep water slowed by 7% per year {over the period of observation].”
Smeed et al., Observed decline of the Atlantic meridional overturning circulation 2004-2012, Ocean Science, February 6, 2014, abstract.
http://www.ocean-sci.net/10/29/2014/os-10-29-2014.pdf
Deep water corals unique in 1,800 years … Changes to the AMOC have allowed subtropical deep nutrient rich waters to invade areas formerly dominated by subpolar nutrient poor waters, changing coral species as the authors state, “We conclude that the persistence of the warm, nutrient-rich regime since the early 1970s is largely unique in the context of the last approximately 1,800 yr.”
Sherwood at al., Nutrient regime shift in the western North Atlantic indicated by compound-specific δ15N of deep-sea gorgonian corals, PNAS, January 18, 2011.
http://www.ncbi.nlm.nih.gov/pmc/articles/PMC3024653/pdf/pnas.1004904108.pdf
An extreme event of sea level rise along the Northeast Coast of North America … from the abstract, ” Here we show that this extreme SLR event is a combined effect of two factors: An observed 30% downturn of the Atlantic meridional overturning circulation during 2009–10, and a significant negative North Atlantic Oscillation index. The extreme nature of the 2009–10 SLR event suggests that such a significant downturn of the Atlantic overturning circulation is very unusual.”
Goddard et al., An extreme event of sea level rise along the Northeast Coast of North America in 2009-2010, Nature Communications, February 24, 2015.
Abstract: http://www.nature.com/ncomms/2015/150224/ncomms7346/full/ncomms7346.html
Press release: https://www.gfdl.noaa.gov/research_highlight/an-extreme-event-of-sea-level-rise-along-the-northeast-coast-of-north-america-in-2009-2010/
Richards, Beetles Warm BC Forests, The Scientist, November 2012.
https://www.the-scientist.com/daily-news/beetles-warm-bc-forests-40148
Base Document:
Katz, Small Pests, Big Problems: The Global Spread of Bark Beetles, Yale Environment 360, September 21, 2017.
https://e360.yale.edu/features/small-pests-big-problems-the-global-spread-of-bark-beetles
https://www.nws.noaa.gov/oh/hdsc/PF_documents/Atlas14_Volume11.pdfIn Houston, actual rainfall today is 39 percent greater than it is supposed to be in 2081-2100 according to the Intergovernmental Panel on Climate Change (IPCC):
An example of how significantly the climate science consensus understates comes from the 2013 IPCC report. This report tells us that by 2081 to 2100, Houston will see up to a ten percent increase in total 5-day, 20-year precipitation accumulation. The USGS published total 5-day precipitation for the 25-year storm in our old climate was about 12 inches in Houston. In Atlas 14, the 25-year, 5-day storm depth is about 16 inches, an increase of 39 percent — already, in 2018, not 2081 to 2100. The actual measured increase in precipitation extremes are 60 to 80 years ahead of schedule and three times as much as IPCC projected.
IPCC AR5 2080 to 2100 projection: Scientific Basis, Chapter 12, Figure 12.26, page 1083.
https://www.ipcc.ch/report/ar5/wg1/
USGS, 5-day, 25-year event, 12 inches.
Atlas of Depth-Duration Frequency of Precipitation Annual Maxima for Texas, USGS, 2004, Figure 50, page 57.
https://pubs.usgs.gov/sir/2004/5041/pdf/sir2004-5041.pdf
NOAA Atlas 14, 5-day, 25-year event, 16 inches.
https://hdsc.nws.noaa.gov/hdsc/pfds/pfds_map_cont.html
Harvey’s Frequency
Houston Public Works says that Harvey was a 20,000 year storm. Texas Climate News cites Houston as having a 167 percent increase in heavy rainfall since the 1950s. Texas’ State Climatologist says Houston’s 2-day, 8-inch rainfall is happening 200 percent more often over the last 30 years. The National Weather Service is telling us that the 100-year storm has already increased 4 to 7.36 inches across Houston.
Metstat, an industry leading rainfall frequency analysis group, says that some areas in the region experienced a 500,000-year storm. The Capitol Weather Gang at the Washington Post with seven meteorologists, says that 60 inches is a once in a million-year storm. NOAA says that over 60 inches fell in Nederland and Groves, Texas (near Beaumont.)
Research out of the Massachusetts Institute of Technology (MIT) gives us an idea of how much our climate has changed in the late twentieth century and in 2017. MIT shows that a 20-inch tropical storm total rainfall was a 100-year storm in Houston for the period 1981 to 2000. To be certain, because storms like Harvey are unprecedented, MIT used 20 inches instead of the 33 inches the Harris County Flood Control District reported as an average total for Harvey across Harris County. In 2017, MIT found that a tropical storm with rainfall in excess of 20 inches has a probability of happening once in 16 years on average. Of paramount importance in this study is that by 2081, if we do not deal with climate pollution, Harvey-like storms are projected to happen on average every five years.
Houston Public Works, 20,000-year storm: Map 2, page 7
http://www.houstontx.gov/council/g/chapter19/Floodplain-Mgmt-Data-Analysis.pdf
Metstat 500,000-year storm: Paragraph 9
https://metstat.com/hurricane-harvey-extraordinary-flooding-for-houston-and-surrounding-areas/
Capital Weather Gang, 1-million-year storm: paragraph 2
https://www.washingtonpost.com/news/capital-weather-gang/wp/2017/08/27/texas-flood-disaster-harvey-has-unloaded-9-trillion-tons-of-water/?utm_term=.a36242b4414d
NOAA 60+ inches: page 6, paragraph 4
https://www.nhc.noaa.gov/data/tcr/AL092017_Harvey.pdf
Texas Climate News, 167%: Paragraph 6
http://texasclimatenews.org/?p=10736
Nielsen-Gammon, 2-day, 8-hour rainfall doubled: slide 14
https://texaslivingwaters.org/wp-content/uploads/2018/03/7-GCWCS-2018-GAMMON.pdf
Atlas 14, 100-year rainfall increased 4 to 7.36 inches: Figure 8. The commonly reported increase of the 100-year storm is 3 to 5 inches and I cannot say where this data was gleaned. Figure 8 clearly shows the difference between TP-40, which was the previous design standard, and the new Atlas 14 is 4 to 7.36 inches.
https://hdsc.nws.noaa.gov/hdsc/pfds/PFDS-Texas/Peer review instructions.pdf
MIT, by 2081, Harvey-like storms are projected to be a five-year occurrence: Abstract. The Abstract says an 18% annual probability which is a 5.5-year storm. I have rounded to 5-years.
http://www.pnas.org/content/114/48/12681
(Free subscription required)
http://www.insurancejournal.com/news/national/2016/04/12/405089.htm This reporting by the Insurance Journal was widely discounted in the press as hyperbolic. Davidson further explained herself in an interview at ClimateCrocks–itself with a substantially questioning title ” New Sea Level Story May be a Step too Far.” The words of Davidson however have great meaning and do not support the title to this piece. ClimateCrocks posted a text from Davidson to Eric Holthaus of Slate, in which the following quote summarizes the pertinent information: “i explained the time lag between observations/data in the field and published approved scientific consensus of peer reviewed literature can be as much as 10 years. and as before, the next approved consensus will likely see a notable uptick in slr [sea level rise] guidance (based upon field work in the period ’05-13) as it will need to have been published by 2017 when the synthesis process begins anew. I am not a scientist, but hang with them a lot. referenced recent paper by Hansen et al (which suggested 3 to 5 meters by 2100 tho Hansen has been saying 5 meters for nearly 15 years.) current work re cryosphere and mass water balance, which is a more recent area of science work. and reports regarding current field observations as mentioned and discussed by experts at various scientific mtgs on presentation rooms an corridors within past 6 months. WA [West Antarctic Ice Sheet] deteriorating rapidly… portions of shelf are now ungrounded with a lens of water underneath like Greenland but different. actually said my personal opinion was 2 to 3 meters in the next 50 years (that 2100 was not a useful frame for most people.)”
ClimateCrocks.com, Peter Sinclair, “Caution: New Sea Level Story May be a Step too Far,” April 21, 2016.
https://climatecrocks.com/2016/04/21/caution-new-sea-level-story-may-be-a-step-too-far/
West Antarctic Ice Sheet Collapse Began Shortly After the Turn of the Century… Scientists have been warning since 2006 that the West Antarctic Ice Sheet was collapsing. Vaughan summarized the science around WAIS collapse beginning in 1981. While the mechanisms for ocean melt were present in publication from the early 1990s, it was not until the early 2000s that work first showed definitive evidence of thinning, grounding line retreat, and ice stream acceleration in one of the most sensitive area of West Antarctica, the Amundsen Sea Embayment. Vaughan concludes that if these symptoms are indeed precursors to collapse, then collapse has begun. From what we know today, he was absolutely correct.
Vaughan, West Antarctic Ice Sheet collapse – the fall and rise of a paradigm, Climatic Change, 2006. http://www.researchgate.net/publication/225166993_West_Antarctic_Ice_Sheet_collapse__the_fall_and_rise_of_a_paradigm
From the University of California Jet Propulsion lab and the California Institute of Technology (abstract): “Upstream of the 2011 grounding line positions, we find no major bed obstacle that would prevent the glaciers from further retreat and draw down the entire basin.”
Rignot et al., Widespread, Rapid Grounding Line Retreat of Pine Island, Thwaites, Smith and Kohler Glaciers, West Antarctica From 1992 to 2011, Geophysical Research Letters, May 27, 2014.
http://onlinelibrary.wiley.com/doi/10.1002/2014GL060140/pdf
From the Polar Science Center at the University of Washington… From the Abstract, “Except possibly for the lowest-melt scenario, the simulations indicate that early-stage collapse has begun.”
Joughin et al., Marine ice sheet collapse potentially underway for the Thwaites Glacier, Science Express, May 12, 2014.
(paywall) http://www.sciencemag.org/content/344/6185/735.abstract
Latest publication on WAIS collapse… This work was just presented at the December 2018 American Geophysical Union Fall meeting and showed that previous findings that the WAIS had already initiated its collapse are now backed up by sediment core data with a sea level contribution of up to 30 feet and 8.5 feet per century. Their findings indicate a full WAIS collapse occurred 125,000 years ago between our latest ice age period and the previous ice age period, when the temperature was similar to Earth’s temperature today. However, the warming rate today is much faster than 125,000 years ago when Earth was transitioning back to orbital cycles that promoted cooling, not additional warming as is being caused by mankind’s greenhouse gas emission today.
Carlson, et al., Absence of the West Antarctic ice sheet during the last interglaciation, Presented to the American Geophysical union Annual Fall meeting, December 10, 2018.
https://agu.confex.com/agu/fm18/meetingapp.cgi/Paper/421418
Two reviews of Carlson’s AGU Presentation…
Paul Voosen, Antarctic ice melt 125,000 years ago offers warning, Science 2018. http://science.sciencemag.org/content/362/6421/1339
Rice, Ancient Antarctic ice sheet collapse could happen again, triggering a new global flood, Phys Org, December 21, 2018.
https://phys.org/news/2018-12-ancient-antarctic-ice-sheet-collapse.htmAdaptability limit to SLR of three feet per century…
Climate Change 2014: Impacts, Adaptation, and Vulnerability. Part A: Global and Sectoral Aspects. Contribution of Working Group II to the Fifth Assessment Report of the Intergovernmental Panel on Climate Change, page 393, paragraph 10.
https://www.ipcc.ch/site/assets/uploads/2018/02/WGIIAR5-PartA_FINAL.pdfWAIS Collapse Initiation Reversal, Feldmann and Levermann… Advanced Antarctic Ice Sheet modeling shows the West Antarctic Ice Sheet has a collapse initiation period where collapse becomes irreversible. If the warming mid-ocean waters that are responsible for the collapse can be returned to normal temperatures by mid-century, the collapse initiation can be reversed. Otherwise, the collapse becomes irreversible after mid-century.Feldmann and Levermann, Collapse of the West Antarctic Ice Sheet after local destabilization of the Amundsen Basin, PNAS, November 17, 2015.
http://www.pnas.org/content/112/46/14191.full.pdf
Ice Cliff Collapse and Abrupt Sea Level Rise, Dynamical Ice Sheet Collapse Modeling Arrives…The abstract from DeConto and Pollard states: “model coupling ice sheet and climate dynamics—including previously underappreciated processes linking atmospheric warming with hydrofracturing of buttressing ice shelves and structural collapse of marine-terminating ice cliffs—that is calibrated against Pliocene and Last Interglacial sea-level estimates and applied to future greenhouse gas emission scenarios. Antarctica has the potential to contribute more than a metre of sea-level rise by 2100 and more than 13 metres by 2500, if emissions continue unabated.” DeConto however, has used a speed limit for their new ice cliff collapse mechanism, (personal communication) “On 5/13/2016 6:06 AM, Rob DeConto wrote: We are imposing a “speed limit” on the cliff collapse mechanism, that could indeed be conservative- especially for cliffs much taller than 100m (which will exist in some places as the ice margin retreats landward). For example, the retreat rate at the face of Jakobsavn glacier in Greenland is >10km/yr, and that’s up in a long fjord choked with ice- with limited communication with open ocean. These cliff margins in Antarctica would be much broader- and will not become as easily choked with melange/bergs. The rate of retreat in the model ensembles maxes out at around 3km/yr- much slower than Jakobsavn. ”
DeConto and Pollard, Contribution of Antarctica to past and future sea level rise, Nature, March 31, 2016.
http://www.documentcloud.org/documents/2823837-DeConto-Pollard-2016-Contribution-of-Antarctica.html
Vaughan, West Antarctic Ice Sheet collapse – the fall and rise of a paradigm, Climatic Change, 2006. http://www.researchgate.net/publication/225166993_West_Antarctic_Ice_Sheet_collapse__the_fall_and_rise_of_a_paradigm From the University of California Jet Propulsion lab and the California Institute of Technology (abstract): “Upstream of the 2011 grounding line positions, we find no major bed obstacle that would prevent the glaciers from further retreat and draw down the entire basin.”
Rignot et al., Widespread, Rapid Grounding Line Retreat of Pine Island, Thwaites, Smith and Kohler Glaciers, West Antarctica From 1992 to 2011, Geophysical Research Letters, May 27, 2014.
http://onlinelibrary.wiley.com/doi/10.1002/2014GL060140/pdfFrom the Polar Science Center at the University of Washington… From the Abstract, “Except possibly for the lowest-melt scenario, the simulations indicate that early-stage collapse has begun.”
Joughin et al., Marine ice sheet collapse potentially underway for the Thwaites Glacier, Science Express, May 12, 2014.
(paywall) http://www.sciencemag.org/content/344/6185/735.abstract
Latest publication on WAIS collapse… This work was just presented at the December 2018 American Geophysical Union Fall meeting and showed that previous findings that the WAIS had already initiated its collapse are now backed up by sediment core data with a sea level contribution of up to 30 feet and 8.5 feet per century. Their findings indicate a full WAIS collapse occurred 125,000 years ago between our latest ice age period and the previous ice age period, when the temperature was similar to Earth’s temperature today. However, the warming rate today is much faster than 125,000 years ago when Earth was transitioning back to orbital cycles that promoted cooling, not additional warming as is being caused by mankind’s greenhouse gas emission today.
Carlson, et al., Absence of the West Antarctic ice sheet during the last interglaciation, Presented to the American Geophysical union Annual Fall meeting, December 10, 2018.
https://agu.confex.com/agu/fm18/meetingapp.cgi/Paper/421418
Two reviews of Carlson’s AGU Presentation…
Paul Voosen, Antarctic ice melt 125,000 years ago offers warning, Science 2018. http://science.sciencemag.org/content/362/6421/1339
Rice, Ancient Antarctic ice sheet collapse could happen again, triggering a new global flood, Phys Org, December 21, 2018.
https://phys.org/news/2018-12-ancient-antarctic-ice-sheet-collapse.html
Prehistoric abrupt sea level jumps of 10 feet per century for centuries on end…
Up to 60 mm per year: Reef backstepping identifies abrupt sea level rise of up to 63 mm per year that persisted for 300 to 500 years. This summary of research looks at three recent deglaciation when both northern and southern ice sheet contributed and a sea level jump during our previous interglacial when the north American Ice Sheet (Laurentide) was absent at 121,000 years before present.
Blanchon, Meltwater Pulses. In: Hopley, D. (Ed), Encyclopedia of Modern Coral Reefs: Structure, form and process. Springer-Verlag Earth Science Series, p. 683-690, 2011.
https://www.academia.edu/421179/Meltwater_Pulses_Encyclopedia_of_Modern_Coral_Reefs
40 mm per year: Deschamps et al., Ice-sheet collapse and sea-level rise at the Bolling warming 14,600 years ago, Nature, March 29, 2012.
http://www.grandkidzfuture.com/earths-climate/ewExternalFiles/meltwater%20pulse%201A%20Nature%202012.pdf
20 feet: O’Leary – Australia, The authors say 6m (20 feet) of sea level rise at 120,000 year before present in 1,000 years. Their data appear to show a few hundred years.
Oleary et al., Ice sheet collapse following a prolonged period of stable sea level during the last interglacial, Nature Geoscience, July 28, 2013.
http://moraymo.us/wp-content/uploads/2014/04/olearyetal_natgeo_20131.pdf
20 to 29 feet: Sea level in recent interglacials with the Eemian, MIS 5e (~129,000 to 116,000 years ago) experiencing sea level rise of 6 to 9 meters above today and a global temperature a few degrees C above today. During MIS 11 (Mid Pleistocene, ~424,000 to 395,000 years ago) there was 6 to 13 m of sea level rise and the temperature was about the same as today.
Dutton et al., Sea-level rise due to polar ice-sheet mass loss during warm periods, Science, July 10, 2015.
http://science.sciencemag.org/content/sci/349/6244/aaa4019.full.pdf?ijkey=X1LVowf1Ilirc&keytype=ref&siteid=sci
65 feet plus sea level rise mid-Pleistocene: Hearty, MIS 11 rocks! The “smoking gun” of a catastrophic +20 m eustatic sea-level rise, Pages, April 2007.
http://www.pages-igbp.org/download/docs/newsletter/2007-1/open_highlights/Hearty_2007-1(25-26).pdf
Hearty et al., A +20 m middle Pleistocene sea-level highstand (Bermuda and the Bahamas) due to partial collapse of Antarctic ice, Geology, 1999. (abstract only)
http://geology.gsapubs.org/content/27/4/375.abstract
Hearty, The Kaena highstand on Oahu, Hawaii: Further evidence of Antarctic Ice collapse during the middle, Pacific Science, 2002. https://www.researchgate.net/publication/29737777_The_Ka’ena_Highstand_of_O’ahu_Hawai’i_Further_Evidence_of_Antarctic_Ice_Collapse_during_the_Middle_Pleistocene
https://academic.oup.com/nsr/article/3/4/470/2669331
Abrupt Change Not Modelable… “We do not yet understand abrupt climate changes well enough to predict them. The models used to project future climate changes and their impacts are not especially good at simulating the size, speed, and extent of the past changes, casting uncertainties on assessments of potential future changes. Thus, it is likely that climate surprises await us.”
Alley et al., Abrupt Climate Change, Inevitable Surprises, National Academy Press, 2002, preface, page v.
https://www.nap.edu/read/10136/chapter/1#v
Sweet et al., Global and Regional Sea Level Rise Scenarios for the United States, NOAA, January 2017.
https://tidesandcurrents.noaa.gov/publications/techrpt83_Global_and_Regional_SLR_Scenarios_for_the_US_final.pdf
Spanger Siegfried et al., When Rising Seas Hit Home, Union of Concerned Scientists, July 2017.
https://www.ucsusa.org/sites/default/files/attach/2017/07/when-rising-seas-hit-home-full-report.pdf
https://www.ucsusa.org/global-warming/global-warming-impacts/sea-level-rise-chronic-floods-and-us-coastal-real-estate-implications
6.6 feet of sea level rise by 2100 above 1992 levels. The 2.4 million homes inundated will happen whenever sea level rise reaches 6.6 feet above 1992 levels.
Spanger Siegfried et al., When Rising Seas Hit Home, Union of Concerned Scientists, July 2017.
https://www.ucsusa.org/sites/default/files/attach/2018/06/underwater-analysis-full-report.pdf