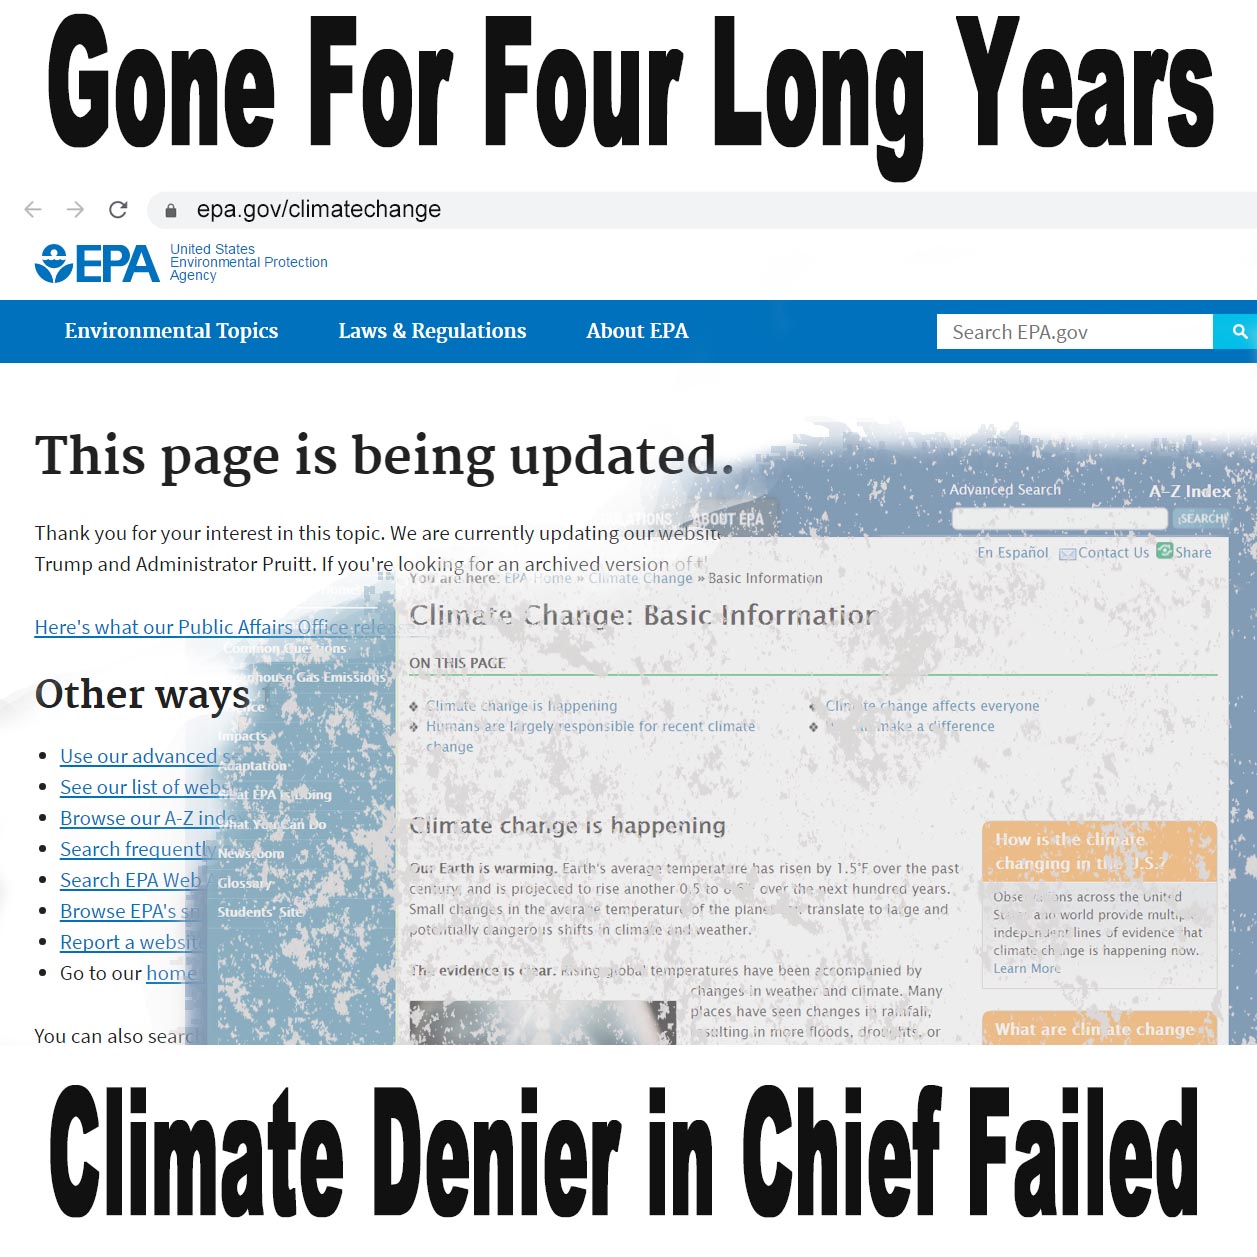

For the first time since the Climate Change Denier in Chief was “elected” in 2016, when he shut down climate science at the US Federal Government, the Environmental Protection Agency has updated their climate change indicator data website. The last four years seems like such an incredibly unbelievable nightmare – so unbelievable that it is hard to believe it really happened.
Some of the highlights of the new data are listed below, and yes unfortunately things are still getting worse faster.
Heat Waves: Since the 1960s, the number of heat waves every year has tripled from 2 to 6, duration has increased by 33 percent from 3 to 4 days, heat wave season has increased 250 percent from 20 days to 70 days, and heatwave extremeness has increased by 25 percent from 2 degrees F to 2.5 Degrees F above the local threshold.
Temperature Records: In a stable climate, new high and low temperature records should be equal in number. Between 1950 and the end of the 1980s, the numbers were almost equal. From 2010 to 2020 on average there were 67 high temperature records in the US every day and 34 low temperature records.
Precipitation Anomalies: A precipitation anomaly is the change in precipitation from normal. In a stable climate precipitation changes from year to year should be equal, with the number of years of greater than average precip are equal to years of lower than average precip. From 1900 to 1990 the numbers were almost equal. From 1990 to 2020 there were 23 years of above normal precip and 7 with below. Only one year in the last 10 was below normal.
Extreme Precipitation: “Heavy precipitation” refers to instances during which the amount of rain or snow experienced in a location substantially exceeds what is normal. From 1910 to 1980, extreme one-day precipitation occurred about 8 days per year. Since 1990 the rate has nearly doubled to 14 days per year. Nine of the top 10 years for extreme one-day precipitation events have occurred since 1996.
Drought: With climate change, dry areas get drier and wet areas get wetter, generally. Since 1900, most of the West has become drier and most of the East has become wetter with much of the Southwest becoming much drier and much of the central Eastern US, and far Northeast becoming much wetter than normal.
Hurricanes: Though the number of hurricanes may or may not have increased in the North Atlantic since 1900 dependent on who is adjusting the numbers for the early part of the century, the energy in hurricanes has definitely increased substantially since 1990.
EPA Climate Change Indicators
https://www.epa.gov/climate-indicators/