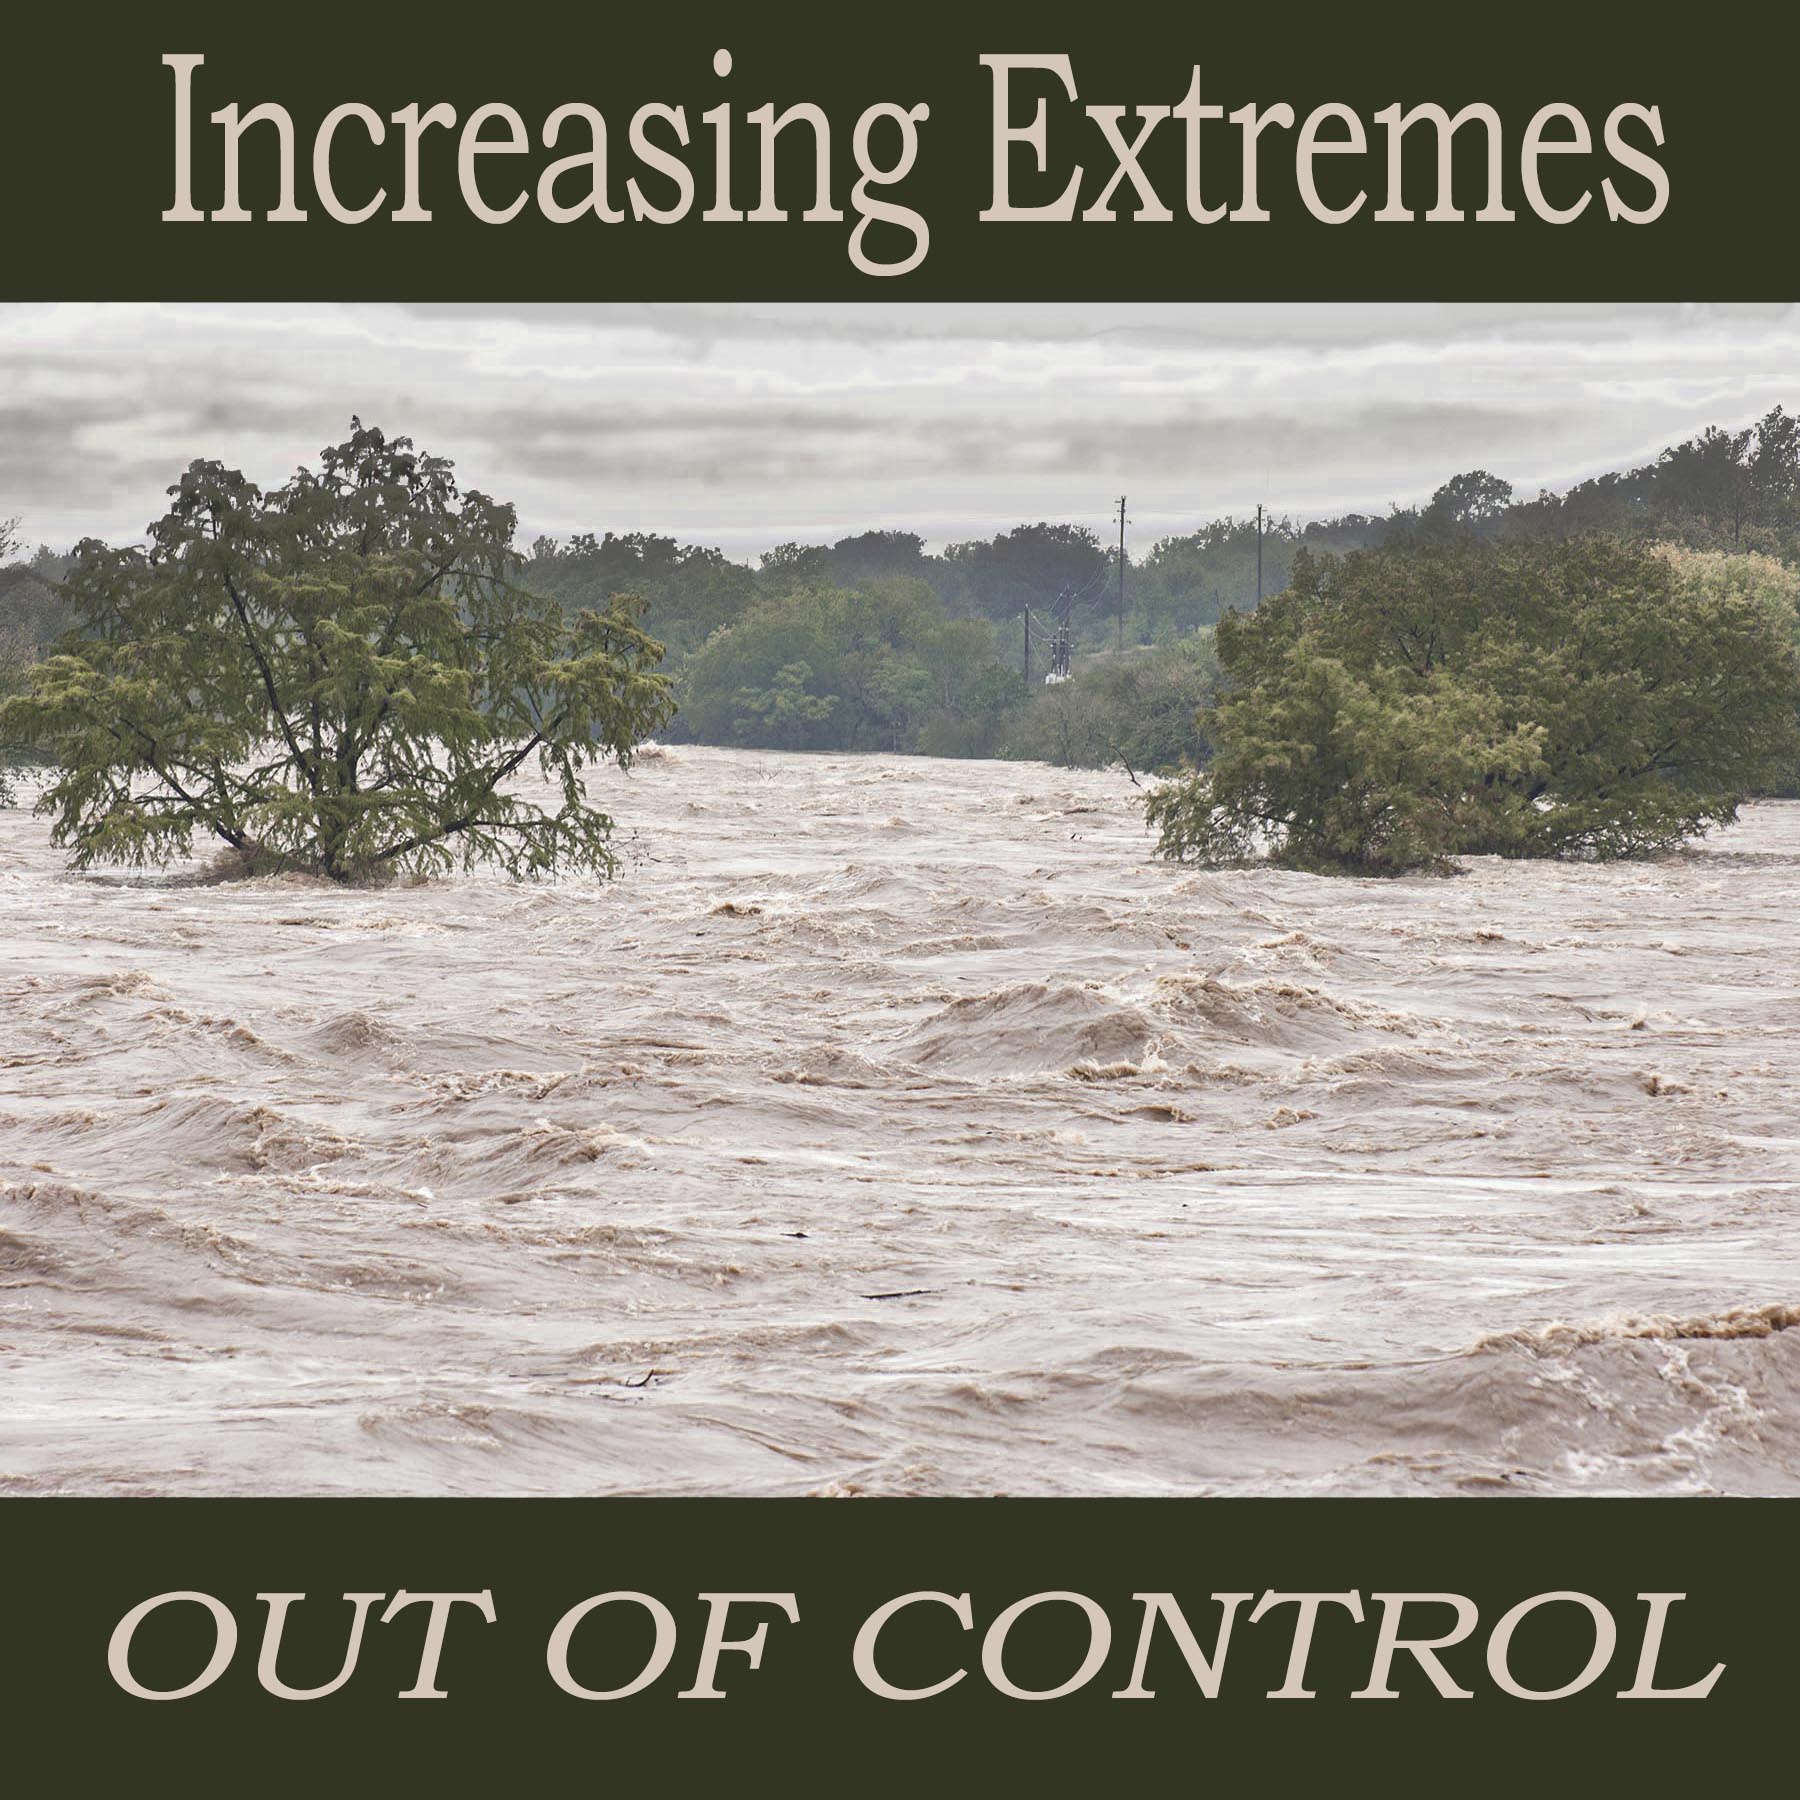

Onion Creek Flood 2013, US 183 bridge, Austin, Texas – new record flood depth.
Climate change has returned to the news in full force with the Council of Parties meeting COP26, the 197 nation meeting of the United Federation Convention on Climate Change. What will come from the meeting is hopefully a more aggressive agreement to cut carbon emissions so as to be able to achieve a maximum warming of 1.5 C (2.7 degrees F) before it is too late to avoid the worst impacts of climate change. In reality, we have passed through this threshold already and this is not really news. Stories that we have already exceeded our carbon budget for 1.5 C are not uncommon.
What is uncommon is reporting on something different, something new; something that changes the fundamentals of climate change response dramatically. This story is about climate tipping systems that have recently activated 100 years ahead of schedule, that now become irreversible uncontrollably, that cannot be stabilized unless we lower Earth’s temperature to less than their tipping thresholds; less than the temperature when their thresholds were crossed of 1.0 degrees C (1.8 degrees F.)
Everywhere we turn extreme weather is increasing at a rate that astonishes. The year 2021 was the seventh year in a row with more than 10 billion dollar weather disasters. The total cost of and number of billion dollar weather disasters in the last eleven years is more than in the previous 31 years. Only five other years since 1980, all between 1998 and 2015, have exceeded 10, billion dollar weather disasters in one year (adjusted for inflation).
 NOAA billion dollar weather events (CPI adjusted)
Everywhere one looks, weather extremes are beyond the worst-case scenario. The National Oceanic and Atmospheric Administration’s (NOAA) 2017 prediction of 14 inches of sea level rise by 2030 and 13 feet by 2100 exceeds the adaptation threshold of three feet per century. (1,2) NOAA’s reporting of 1.5 inches of sea level rise rise on average at all lower 48 US tide gauges in 2019 triples the previous record. (3) The wildfires in California are now burning 400 degrees hotter and are burning as much area as in pre European times only now we are spending $1.3 billion annually putting them out. (4, 5, 6) The Capital Weather Gang says Hurricane Harvey was a 1-million-year event in our old climate. (7) Winter Storm Uri, Texas’ Valentines Day ice bomb, cost as much as Hurricanes Harvey and Katrina combined. (8) More than half of known climate tipping systems are active; they become irreversible with no further warming and nearly half have feedbacks relationships with others that increase the speed and extremeness of their collapses. (9) Permafrost, the Amazon, and Canadian forests have all flipped from carbon sink to carbon source emitting at least 5 gigatons CO2e annually. (10)

Nineteen percent of all known sequoias were killed by fire in 2020 and 2021. Thousands of years old sequoias with their giant stature, limbless trunks, two-foot thick fire resistant bark, and water-based sap
are almost completely impervious to fire, in our old climate.
The threats to our human culture and its infrastructure are clear. The fires, floods, droughts, heat waves, hurricanes and ice bombs are out of control. Our planet’s infrastructure engineering is now far underdesigned in ways not yet even imaginable as the ice bomb in Texas in 2021 illustrates with the collapse of the Texas energy grid, mostly due to non-clean energy reasons, where up to 978 people died with 20 million Texans being without power for an average of 42 hours with lows near zero. (11) This ice bomb, also known as Winter Storm Uri, is a good example of understatements in climate disasters.
The Texas State Climatologist John Nielsen-Gammon has released a report on extreme weather in Texas that says since 1975, 100-degree days at all Texas rural stations have increased by 450 percent, at semi-rural stations by 390 percent, and urban stations by 260 percent. (12) While the average hottest day of the year across Texas since 1975 has increased by about 1 degrees C (1.8 degrees F,) the average coldest day of the year has increased by about 3 degrees C (5 degrees F.)
What Texas’ State Climatologist John Nielsen-Gammon has to say about rainfall extremes in Texas is, “If extreme rainfall amounts increase by just 20 percent, the 100-year rainfall event threshold is exceeded twice as often.” Texas has seen a 30 percent increase in rainfall exceeding the 100-year storm since 1960. But this is the long term view that is skewed by time. In other words, time has introduced an understating bias because our climate has just only recently started to become more extreme in a meaningful way.
Data from NOAA’s new Atlas 14 Precipitation Frequency Evaluation tells us from Houston to Austin, the 100-year storm is now the 25-year storm. The 100-year total in Houston increased from 12 to 16 inches, and in Austin from 10 to 13.5 inches, and most of the increase has come recently. (12)
But the Intergovernmental Panel on Climate Change (IPCC), the largest climate science consensus organization in the world, tells us that by 2081 to 2100, both Houston and Austin will see up to a ten percent increase in total 5-day, 20-year precipitation accumulation. The 5-day actual rainfall today in Houston according to Atlas 14 is 39 percent greater than it is supposed to be with IPCC’s 2081-2100 projections. In Austin it is 20 percent greater today than IPCC says it is supposed to be at the end of the century. The actual measured increase in precipitation extremes are 60 to 80 years ahead of schedule and two to three times as much as IPCC projected for 2100. (13) Obviously, the Intergovernmental Panel on Climate Change (IPCC) modeling is significantly understated. Because we base our climate policy on IPCC’s consensus reviews of climate science, this is a dangerous.
 Halloween Flood debris, Austin, Onion Creek, 1,800 to 2,300 year event
Out of Control: Why the Dangerous Warming Limit is Less Than 1.0 Degrees C, not 1.5 C
Non-stationarity is a fundamental of statistical analysis of what is called frequentist statistics. It is very common in climate change evidence and is one of the leading challenges in understanding the speed and extremeness of climate change. Because of understatements caused by non-stationary data, impacts today are vastly ahead of projections, and future impacts will be wildly more understated than they already are.
Non-stationarity is technically defined as a data set that is not stable, or is changing. A stable data set is fundamental to using statistics to predict the future from the past. If the data set is not stable, results of analyses are biased if traditional statistics are used to evaluate the data. With a warming climate, this results in a low bias or impacts are understated. To understand non-stationarity we simply look at how climate science works.
Our climate changes over time frames from very short (abrupt changes like we are seeing with the increasing extremes now), to long (the climate models’ projections used to develop policy that tell us how our climate will change by 2100 under different scenarios), and very long (orbital and geologic climate change that is caused by changes in Earth’s orbit around the sun and chemical and physical changes in climate caused by rock weathering, continental drift, and related ocean circulation changes like from the closing of the Isthmus of Panama that created a two ocean world about 3 million years ago).
Climate scientists collect data on climate change over time to see how our climate is changing based on real evidence, like sea level rise data from tide gauges, or temperature and precipitation data from weather stations. Using temperature as an example, in our old climate there were small changes in temperature over periods of 30 years or longer that happened naturally. These changes were caused by things like El Nino in the equatorial Pacific where natural changes in ocean circulation are so large they create 6 to 18 month warming or cooling of Earth’s average temperature of about 0.1 to 0.2 degrees C (0.2 to 0.4 degrees F.)
Humans have created much larger changes of about 1 degree C (1.8 F) in the last 200 years with 0.5 degrees C warming 1980 to 2014 and 0.26 degrees C warming in just the last four years. But because our changing climate has only just begun to warm above the natural range of our old climate, the new changes are poorly reflected in the overall data that has much longer time frames where our temperature was relatively stable.
The non-stationarity problem is like an average. The recent and large short term warming is going to be minimized in the long-term average. Because of non-stationarity understatements, scientific evaluation cannot accurately tell exactly how much our climate has already changed.
 South Padre Island Sea Level Rise, In some places the dunes have been completely eroded away
 This is what Padre looked like in 1989 – a hundred yard wide beach was common, some areas were much wider.
To be clear, this is not a problem of the future, it is a problem now. This is because the trend in climate change is largely reliant on data from our past. Current trends are therefore underestimated. This is one of the reasons why we see climate changes happening faster than previously understood. (14)
Generally, it takes 30 years of weather data to develop statistical accuracy. Because our climate has just recently begun to change radically, it is really difficult to extract the true meaning of the recent abrupt changes in weather mayhem using valid statistics, but it is not difficult to believe what we are seeing and experiencing with our own eyes.
Earth Systems Collapse – Climate Tipping Threshold Crossing: Why The Dangerous Warming Target is 1.0, Not 1.5 Degrees C warming
Irreversible climate tipping or Earth systems collapses have now been activated. These include collapse of the Antarctic and Greenland’s ice sheets, Arctic sea ice, permafrost, the Amazon, the Gulf Stream, and corals. These systems were not supposed to collapse, or cross thresholds where they evolve to different states, until after 5 degrees C (9 degrees F) warming above normal, where today we have warmed Earth to about 1.0 degrees C (1.8 degrees F) above normal.
About half of known tipping systems have relationships with other systems or feedbacks that enhance the rate and extremeness of those other systems collapses, and once activated, tipping does not stop unless the perturbation is removed. In other words, tipping is irreversible unless we cool Earth back to within the evolutionary boundary conditions where our systems evolved. (See references 9)
These boundary conditions are pivotal to final scenario outcomes. Because they are happening with 1 degree C warming instead of at the 5 degree C threshold assumed for much of the last 30 years, time frames for meaningful action to reverse warming, not allow warming to continue to the commonly accepted target of 1.5 degrees C (2.7 degrees F) above normal, are now much abbreviated, and needed actions are much increased.
Please do not confuse these needed actions with accelerating net zero global emissions like we see coming from the international Council of Parties (COP26) climate meeting in Glasgow. These new actions required to remove the warming that has caused Earth systems to begin collapsing are actions to remove excess greenhouse gas pollution accumulated in our atmosphere. We need to remove 1,000 to 2,000 gigatons of CO2 from our atmosphere to restore it to stable conditions within the boundaries of the evolution or our Earth’s systems. This is 20 to 40 times more CO2 than the 50 gigatons of annual emissions we need to address to create net zero emissions. (15)
 Read this epic story first published on The Rag Blog, New Journalism Project
February 10, 2022
Evolutionary Boundaries and Earth Systems Collapse 100 Years Ahead of Schedule
Extreme weather is one indicator that our Earth systems are collapsing. The impacts we are therefor seeing today from activated tipping, were not supposed to happen until some point in the distant future after the year 2100. With all the understatements in climate science, and the 30-year delay in climate pollution action, dystopian climate change impacts that were not supposed to happen until far in the future are happening today. If not stopped, the irreversible outcomes result in unrecoverable scenarios. We have allowed our climate to change beyond its evolutionary boundaries that are fundamental to survival of our advanced civilization.
Dystopian climate change outcomes have now been initiated 100 years ahead of schedule. These things are reflected in the radically increasing weather extremes. We have crossed thresholds but, exactly what are these thresholds and what do they mean?
Our climate had a normal range of temperature where the average global temperature fluctuated about 0.5 to 1.0 degree C over the last 10,000 years. This is known as the natural variation of our old climate. It defines the evolutionary conditions that created our Earth systems and its ecologies. When we warmed above 0.5 C degrees above the normal average of our old climate, our Earth systems began to degrade. (15)
With 1.0 degrees C warming we now see Earth systems collapses where degradation of sub-continental scale ecologies has now reached a level where those systems are no longer absorbing carbon dioxide and other greenhouse gases, they are emitting them. The environmental services provided by these systems are vanishing and being replaced by additional climate pollution emissions in yet another feedback that causes our climate to change even faster, creating biological systems collapse much faster than is occurring now.
These collapses have just begun and are represented by the collapses recently identified in the Amazon, permafrost and Canadian forests (see reference 10), and as go these large scale ecologies, likely so goes the rest of similar ecologies globally. If we do not remove the perturbation by somewhere around mid-century, these collapses coalesce and create existential scenario for humankind.
REFERENCES
(1) NOAA 2017, 14 inches by 2030… NOAA “(90 cities along the U.S. coastline outside of Alaska) that with only about 0.35 m (<14 inches) of local RSL rise, annual frequencies of such disruptive/damaging flooding will increase 25-fold by or about (±5 years) 2080, 2060, 2040 and 2030 under the Low, Intermediate-Low, Intermediate and Intermediate High subset of scenarios, respectively.” page vii
UCS ” By 2035, the number of EICs nearly doubles (to 167) compared to today with the Intermediate-High scenario. That number rises to 272, 365, and 489 in the years 2060, 2080, and 2100″Sweet et al., Global and Regional Sea Level Rise Scenarios for the United States, NOAA, January 2017.
https://tidesandcurrents.noaa.gov/publications/techrpt83_Global_and_Regional_SLR_Scenarios_for_the_US_final.pdf
Union of Concerned Scientists 2017…
Spanger Siegfried et al., When Rising Seas Hit Home, Union of Concerned Scientists, July 2017.
https://www.ucsusa.org/sites/default/files/attach/2017/07/when-rising-seas-hit-home-full-report.pdf
UCS summary page – https://www.ucsusa.org/resources/when-rising-seas-hit-home
(2) Three feet per century sea level rise adaptation threshold… Greater than three feet sea level rise per century results in unrecoverable economic scenarios… IPCC tells us that “Nicholls et al. (2011) show that only a limited number of adaptation options are available for specific coastal areas if sea level exceeds a certain threshold (1 m) at the end of the century.”
Climate Change 2014: Impacts, Adaptation, and Vulnerability. Part A: Global and Sectoral Aspects. Contribution of Working Group II to the Fifth Assessment Report of the Intergovernmental Panel on Climate Change, page 393, paragraph 10.
https://www.ipcc.ch/site/assets/uploads/2018/02/WGIIAR5-PartA_FINAL.pdf
(3) NOAA’s average of 1.5 inches of sea level rise in the US in 2019… “In 2019 (12) the national (median) HTF [high tide flooding] occurrence along U.S. coastlines as a whole was 4 days. This is 1 day less than the record reached in 2018 as measured by 98 NOAA tide gauges (13) (Figure 3a). Assessed over several decades, the national trend in HTF frequency is accelerating, and HTF is more than twice as likely now as it was in 2000. The rapid growth is in response to RSL rise, which is occurring along most U.S. coastlines. (Our study does not include Alaska, where land-based ice melt is contributing to land rebound (14)). In 2019, RSL along U.S. coastlines (median value) reached an all-time record of 0.34 m since 1920 (last 100 years), which is about 4 centimeters (1.5 inches) higher than it was in 2018. The national RSL (linear) trend along U.S. coastlines examined here is 2.8 millimeters/year over this period (not shown). Inherent to the RSL measurement in Figure 3a is the effect of land subsidence, which nationally (median plus or minus standard deviation value of the 98 tide gauges monitored) is occurring at a rate of 0.7 ±1.4 mm/year, but can be as high as 7 mm/year along the coastline of Louisiana (Zervas et al., 2013; Sweet et al., 2017). Annual mean RSLs at most East and Gulf Coast tide gauges (57 of the 62) broke their historical records (Figure 3b) in 2019 by (median value) 2.6 cm (about 1 inch).”
Press Release – NOAA, U.S. high-tide flooding continues to increase, July 14, 2020
https://www.noaa.gov/media-release/us-high-tide-flooding-continues-to-increase
New NOAA Technical Report on high tide flooding:
NOAA 2019 State of U.S. High Tide Flooding with a 2020 Outlook, TR 092, July 2020, page 3 and 4.
https://tidesandcurrents.noaa.gov/publications/Techrpt_092_2019_State_of_US_High_Tide_Flooding_with_a_2020_Outlook_30June2020.pdf
Also see a letter from principle William Sweet – 23 July 2020
https://oceanservice.noaa.gov/aa-updates/high-tide-flooding-outlook-072320.html
(4) California wildfires are burning 400 degrees hotter… Wildfires are burning 400 degrees F hotter because of drier fuels. “The infernos bellowed by those winds once reached a maximum temperature of 1,700 degrees Fahrenheit, Cal Fire’s Angie Lottes says; now they reach 2,100 degrees, hot enough to turn the silica in the soil into glass.”
Wallace-Wells, Los Angeles Fire Season Is Beginning Again. And It Will Never End. A bulletin from our climate future.
By David Wallace-Wells, NYMag, May 12, 2019.
http://nymag.com/intelligencer/2019/05/los-angeles-fire-season-will-never-end.html
(5) California Wildfires burning as much as pre European Times… In 2020 California met their pre-European area burned area average of 4 million acres, doubling their previous contemporary record set in 2018 of 1.975 million acres, which doubled the previous record set in 2003 of 1.02 million acres.
Stephens et al., Prehistoric fire area and emissions from California’s forests, woodlands, Forest Ecology and Management, June 6, 2007.
https://www.sierraforestlegacy.org/Resources/Conservation/FireForestEcology/FireScienceResearch/FireHistory/FireHistory-Stephens07.pdf
(6) California Wildfires, $1.3 Billion in suppression in 2020… A few months later, the August siege of dry lightning turned 2020 into a record-shattering wildfire year. The state’s emergency firefighting costs are expected to hit $1.3 billion, pushing the California Department of Forestry and Fire Protection’s total spending this fiscal year to more than $3 billion.
https://www.latimes.com/environment/story/2020-12-23/billions-spent-fighting-california-wildfires-little-on-prevention
(7) Capital Weather Gang: Harvey was a 1-million-year storm… Hurricane Harvey was a 1-million year storm in our old climate, or a storm that happens in the very long term in our old climate of once in a million years, paragraph 2.
Cappucci, Texas flood disaster: Harvey has unloaded 9 trillion gallons of water, Washington Post, August 27, 2017.
(Paywall) https://www.washingtonpost.com/news/capital-weather-gang/wp/2017/08/27/texas-flood-disaster-harvey-has-unloaded-9-trillion-tons-of-water/?utm_term=.a36242b4414d
As reported in the Chicago Tribune.
https://www.chicagotribune.com/nation-world/ct-texas-flood-water-20170827-story.html
(8) Cost of URI – $200 to $295 Billion, more than Katrina and Harvey combined… The Perryman Group is an economic research and analysis firm based in Waco, Texas, serving the needs of more than 2,500 clients, including two-thirds of the Global 25, over half of the Fortune 100, the 12 largest technology firms in the world, 10 US Cabinet Departments, the 9 largest firms in the US, the 6 largest energy companies operating in the US, and the 5 largest US banking institutions.
The Perryman Group – Preliminary Estimates of Economic Costs of the February 2021 Texas Winter Storm, February 2021.
https://www.perrymangroup.com/media/uploads/brief/perryman-preliminary-estimates-of-economic-costs-of-the-february-2021-texas-winter-storm-02-25-21.pdf
Most expensive disasters… Harvey $133.2 billion, Katrina $167.4 billion, total $300.6 billion.
https://en.wikipedia.org/wiki/List_of_disasters_by_cost#cite_note-200_billion-10
(9) More than half of known tipping points are now active up to 100 years ahead of projections… Nine Earth systems collapses have been identified by scientists as active: Arctic sea ice, Greenland ice sheet, boreal forests, permafrost, the Gulf Stream, the Amazon, coral, the West Antarctic Ice Sheet and parts of the East Antarctic Ice Sheet. Until 2018, the Intergovernmental Panel on Climate Change (IPCC) has assumed that tipping would not occur before 5 C of warming above preindustrial times, something that the worst-case scenario put well into the 22nd century. In 2018 however, IPCC lowered this limit to between 1 and 2 C above preindustrial times in both the 1.5 C Report and the Cryosphere Report. Lenton tells us, “The Intergovernmental Panel on Climate Change (IPCC) introduced the idea of tipping points two decades ago. At that time, these ‘large-scale discontinuities’ in the climate system were considered likely only if global warming exceeded 5 °C above pre-industrial levels. Information summarized in the two most recent IPCC Special Reports (published in 2018 and in September this year) suggests that tipping points could be exceeded even between 1 and 2 °C of warming.” Climate tipping is now active greater than 100 years ahead of projections.
Lenton et al., Climate tipping points-too risky to bet against, Nature, November 27, 2019.
https://www.nature.com/articles/d41586-019-03595-0
University of Exeter Press –
http://www.exeter.ac.uk/news/featurednews/title_767753_en.html
(10) Natural Systems already flipped from carbon absorption to emissions: permafrost, Amazon, Canadian forests, and are likley emitting over 5 Gt Co2eq annually… These three systems have flipped from sequestration to emissions with a total reported annual emissions of about 3.5 Gt CO2 (CO2eq) per year. Considering the rest of our worlds similar ecologies are behaving likewise, the annual emissions are at least 5.5 Gt, net.
Permafrost collapse of 2.3 Gt CO2 annual emissions, averaged 2003 to 2017… Since permafrost was stable in 2003, the annual in 2017 was much higher than 2.3 Gt, and today the acceleration in warming is even greater than in 2017.
Natali et al., Large loss of CO2 in winter observed across the northern permafrost region, Nature Climate Change, October 21, 2019.
https://www.uarctic.org/media/1600119/natali_et_al_2019_nature_climate_change_s41558-019-0592-8.pdf
Amazon collapse of 1 Gt annual CO2eq emissions 2010 to 2018… The current emissions are likely greater because this 1 GT is an average, and the averaging period stopped in 2018 and it’s not at all likely things have gotten better since. Tropical forests in Africa are a bit behind the Amazon, but couldn’t be far and Asian tropical forests likely similar to the rest of the world.
Gatti et al., Amazonia as a carbon source linked to deforestation and climate change, Nature, July 14, 2021.
https://www.nature.com/articles/s41586-021-03629-6.epdf?sharing_token=lsfPlVRsW05dUMB_VD-zItRgN0jAjWel9jnR3ZoTv0NILaci0q8CXtVe4JKM-xF0Z0ZQpmJpnpSclAjJeIV-vCjviXK_Mb9hvvU5C3CiJVgu82-RGuHR01gFiQZAVMzDCCxiRyvlh0MBQxTvGN2oHmf2jIOC7MEEGXrOPGIblsh57v9qXkkZbM7U0OH8zbdQ4jnVO1zD9R1jeDcUVBS22YVLkjWEvC5vrNMdQ416fmEBL9kIHYs2ptVibFKXLxEuh-TQ08w-QGSFzN6221KgguYTe0Q9FoZ1J-Wksf4tWXrjv-xu34UpgYqxQWwLTTbTgHYTuglT_tSVd4WaweL9fg%3D%3D&tracking_referrer=www.theguardian.com
Canadian Forest Collapse 250 million tons CO2eq annually in 2018… Canadian forests have been emitting since about 2002. It’s mostly the bark beetle attack. They peaked about 2007 when the mountain pine beetle destroyed most of the large expanses of lodgepole pine forests in Canada. Now we have new bark beetle species on the rise: spruce and fir beetles. They are not as aggressive as the pine bark beetle responsible for the earlier mayhem, but there are more species of each and far more trees to eat so the risk is much greater. See page 39 in the Canadian Forest Report. Also note that the Canada data is through 2018 . There were huge new attacks in 2018 and we all know the direction the trend is headed, nonlinearly. Canadian forests are also likely identical to the great Russian forests and in total across the globe, emissions are likely 1 Gt from high latitude or high altitude forests.
The State of Canada’s Forests, Adapting to Change, Canadian Forest Service, 2020.
https://www.nrcan.gc.ca/our-natural-resources/forests-forestry/state-canadas-forests-report/16496
Total new annual emissions CO2 (CO2eq) from Earth’s natural systems, considering global conditions are similar…
Permafrost: 2.3 Gt average 2004 to 2017, or likely more than 3 GT annually
Tropical forests: 1.0 Gt from the Amazon, or likely 1.5 Gt annually
High latitude and high altitude forests: 250 Gt annually for Canadian forests, or likely 1 Gt annually when considering global high altitude forests and global high latitude forests from bark beetle mortality
Fire: unknown
Oceans: unknown
Soils beyond permafrost: unknown
Total: 5.5 Gt
(11) 20 million without power… At the peak of the storm, 69 percent of Texans, 20 million people, were without power… “More than two out of three (69%) Texans lost electrical power at some point February 14-20, for an average of 42 hours, during which they were without power on average for one single consecutive bloc of 31 hours, rather than for short rotating periods.” The Winter Storm of 2021, Hobby School of Public Affairs, University of Houston https://uh.edu/hobby/winter2021/st orm.pdf
(12) Nielsen-Gammon Extremes in Texas…
100-degree days, graphic on page 7…
Rural Stations: 2.5 100-degree days in 1975, 11.5 in 2020, for a 450% increase
Rural Stations: 3.75 100-degree days in 1975, 14.5 in 2020, for a 387% increase
Semi-Rural Stations: 6.5 100-degree days in 1975, 17 in 2020, for a 261% increase
Longer time frames show less increase, exhibiting a classic non-stationarity response where our recent and rapidly changing climate is biased low because recent and rapidly changing data are averaged in with the long term more stable data.
Average hottest and coldest day of the years, graphic on page 9…
Nielson-Gammon et al., Assessment of Historic and Future Trends of extreme Weather in Texas, 1900 – 2036, Texas A and M University, State Climatologist Office, October 2021.
https://3hr27o3s9nj8m84dw4489i31-wpengine.netdna-ssl.com/wp-content/uploads/2020/03/ClimateReport-1900to2036-1.pdf
(13) Comparison of Atlas 14 rainfall evaluation and IPCC…
Austin 100-year now the 25-year –
http://www.austintexas.gov/page/flood-risk-and-atlas-14-details
IPCC AR5 2080 to 2100 projection: Scientific Basis, Chapter 12, Figure 12.26, page 1083.
https://www.ipcc.ch/report/ar5/wg1/
USGS, 5-day, 25-year event: Note: the USGS evaluated the 5-day 25-year event and IPCC 5-day 20-year event so the comparison is not exactly equal, but close.
Atlas of Depth-Duration Frequency of Precipitation Annual Maxima for Texas, USGS, 2004, Figure 50, page 57.
https://pubs.usgs.gov/sir/2004/5041/pdf/sir2004-5041.pdf
NOAA Atlas 14, 5-day event.
https://hdsc.nws.noaa.gov/hdsc/pfds/pfds_map_cont.html
(14) Non-stationarity of Data – Problem Statement… Problem Statement #1, page 2, “Ignoring time-variant (non-stationary) behavior of extremes could potentially lead to underestimating extremes and failure of infrastructures and considerable damage to human life and society.”
Cheng, Frameworks for Univariate and Multivariate Non-Stationary Analysis of Climatic Extremes. Dissertation, Univ Cal Irvine, 2014.
https://escholarship.org/content/qt16x3s2cp/qt16x3s2cp_noSplash_df70523d588ef903df391e21a1bfd201.pdf
Non-stationarity of Data Problem – General Discussion
Statistical analysis assumes data do not include a changing trend, or that the data are stationary. This allows evaluation of the past to predict the future, if boundary conditions in the past are the same as in the future. If boundary conditions change, robust statistical evaluation is not possible unless the data are assumed to be stationary. This is a catch-22, or a dilemma or difficult circumstance from which there is no escape because of mutually conflicting or dependent conditions. (Oxford) This problem is particularly troublesome with climate change data that have an increasing nonlinear trend, where for example, rainfall is increasing nonlinearly with warming. Non-stationarity can be dealt with to some extent using sophisticated analysis, but if a data evaluation states “the data are assumed to be stationary,” sophisticated statistics were not used and the results of the analysis cannot be relied upon.
“In the most intuitive sense, stationarity means that the statistical properties of a process generating a time series do not change over time. It does not mean that the series does not change over time, just that the way it changes does not itself change over time.”
Palachy, Stationarity in time series analysis – A review of the concept and types of stationarity, Towards Data Science (independent forum)
https://towardsdatascience.com/stationarity-in-time-series-analysis-90c94f27322
Sea level rise… Non-stationarity is a data description that describes some data that does not conform to the rest. The example with climate change-caused sea level rise is that the rapidly increasing rate of sea level rise from global warming does not occur anywhere else in the data record. Beginning about ten years ago, sea level rise rates began accelerating at a rate faster than anything in the tide gauge record. When this data behavior occurs, normal statistics cannot be used to evaluate that data. Because weather and natural phenomena have large natural variability, it takes time to gather enough data for statistics to be accurate. This time allows for a stationary data set to develop. Current sea level rise across the US East and Gulf coasts (2019) ranges from about 2.5 to 5.5 mm per year as per NOAA’s long term trends, and 3 to nearly 7 mm per year as per VIMS (VIMS produces a more accurate reflection of actual sea level rise rates, though still biased low. See discussion below.) This current sea level rise rate indicates that much of the US East and Gulf coasts are currently undergoing erosion and degradation, and significant amounts have passed through disintegration and conversion to open water thresholds. It is important to note however that these rates of sea level rise (2.5 to 5.5 mm per year) are impacted by non-stationary data and understate current reality.
NOAA Tides and Currents, Sea Level Trends… NOAA uses the entire tide gauge record to determine sea level rise trends. Most gauges have records that extend 50 to 80 years or more, understating the short term increasing sea level rise trend.
https://tidesandcurrents.noaa.gov/sltrends/
University of Virginia Institute of Marine Sciences Sea-level Report Cards (VIMS)… VIMS uses the latest 36 years of data to determine their sea level rise rates at 32 locations on the US East, Gulf and West Coasts. This shorter time frame than NOAA uses results in sea level rise rates that are approximately 20 percent greater than NOAAs. Still, these rates are biased lows as they cannot adequately capture the increasing trend of sea level rise that is greater in the last 10 or fifteen years than in the previous 20 to 25 years of VIMS record.
https://www.vims.edu/research/products/slrc/index.php
(15) 1,000 to 2,000 gigatons atmospheric CO2 removal needed to stabilize climate tipping… To stabilize our climate tipping and avoid existential climate change scenarios we must return our climate to within the evolutionary boundaries of our Earth Systems. This means cooling Earth’s temperature to less than our temperature today of 1.0 degrees C warming above normal, and likely to less than 0.5 degrees C or the maximum range of natural variability of our old climate. The only way to do this in time frames that matter to irreversible tipping is to remove long-lived CO2 (and other greenhouse gases) from our atmosphere. Restoring our climate could certainly be achieved through cessation of future emissions, but because of the very long life of greenhouse gases, it would take centuries to a thousand years. Meanwhile, tipping becomes irreversible with the results of existential scenarios. The reason there is a broad range of from 1,000 to 2,000 gigatons CO2 is because of time and because the academic literature ha not yet caught up to scenarios needed to reverse tipping that has just been identified as being active. The lower 1,000 gigatons removal is from a 1.5 degrees C target and the time dependency issues is because of natural feedbacks from warming. As we delay further, warming already occurred has caused natural systems to flip from absorbing to emitting greenhouse gases (See reference 10.) Further warming increase the speed and extremeness of these collapse with proportionately increasing feedback emissions.
Net Zero by Mid-century… “In model pathways with no or limited overshoot of 1.5°C, global net anthropogenic CO2 emissions decline by about 45% from 2010 levels by 2030 (40–60% interquartile range), reaching net zero around 2050.”
IPCC 1.5 C Report, Summary for Policymakers (SPM), page 12, C1, 2018.
https://www.ipcc.ch/site/assets/uploads/sites/2/2019/05/SR15_SPM_version_report_LR.pdf
IPCC, 1.5 C Report Up to 1,000 Gt Negative Emissions… “All pathways that limit global warming to 1.5°C with limited or no overshoot project the use of carbon dioxide removal (CDR) on the order of 100–1000 GtCO2 over the 21st century. CDR would be used to compensate for residual emissions and, in most cases, achieve net negative emissions to return global warming to 1.5°C following a peak (high confidence).”
IPCC 1.5 C Report, Summary for Policymakers, Page 17, C.3, 2018.
https://www.ipcc.ch/site/assets/uploads/sites/2/2019/05/SR15_SPM_version_report_LR.pdf
100 gigatons CO2 removal from IPCC is understated… Realistically, the Summary for policy makers understatement as can be seen by findings presented in the rest of the report and as evaluated by Carbon Brief in the link below. The realistic CDR quantity as presented by IPCC is 1,000 gt by 2100…Deeper analysis of the 1.5 C report shows that the 100 Gt range is not generally a part of the detailed presentation in the remainder of the report. Figure 2.13.c, Chapter 2, Mitigation Pathways, shows the cumulative amount of CDR needed to achieve 1.5 C by 2100 that includes a range of 100 to 1,250 Gt, not 100 to 1,000 Gt as stated in the Summary for Policymakers. Graph c in Figure 2.13 depicts this range with the blue dashed lines, with the green dashed line the most likely outcome (outlined in bright green by the author).
IPCC 1.5 C, Chapter 2, Figure 2.13, page 128:
https://www.ipcc.ch/site/assets/uploads/sites/2/2019/05/SR15_Chapter2_Low_Res.pdf
Carbon Brief Summary of 1.5 C Report – IPCC’s 100 to 1,000 Gt CDR Understatement…Carbon Brief interview with Oliver Greden, head of the research at the German Institute for International and Security Affairs say, “Compared to the full report, the SPM paints too rosy a picture on this. The SPM talks about 100-1,000Gt CO2 removal by 2100. But the report itself shows a mean CDR value much closer to the upper end of the 100-1,000 GtCO2 range.”
In-depth Q&A: The IPCC’s special report on climate change at 1.5C, Carbon Brief, August 10, 2018.
Quote from Section: What role will ‘negative emissions’ play in limiting warming to 1.5C? Seventh paragraph.
https://www.carbonbrief.org/in-depth-qa-ipccs-special-report-on-climate-change-at-one-point-five-c
Figure 2.13, IPCC 1.5 C report
Net Zero by Mid-century… In the graphic below are the emissions reductions and negative emissions depicted graphically in the IPCC 1.5 C Report SPM, page 13. Negative emissions are anything that removes carbon dioxide directly from the sky like forests of chemical and mechanical air pollution treatment processes. On the left, net zero emissions can be seen when the scenarios (multiple lines and shading) cross the zero acis and becomes negative, which represents negative emissions described above.
IPCC 1.5 C Report 2018, Summary for Policymakers, Figure SPM.3a, Global Emissions Pathways
In the graphic below, four pathways are presented with net zero emissions mid century and increasing negative emissions (orange and yellow shading). On the energy intensive path we have been on for the last 30 years, and with our track record of emissions increasing despite everything we have tried to do, it is imperative we choose a safe path to ensure we do not create existential scenarios. also remember, these scenarios are for a 1.5 degrees C target. To stabilize tipping that has recently become active 100 years ahead of widespread and long-held projections, we need to remove much more CO2 and other greenhouse gases from our atmosphere to achieve a target of Less than 1 degrees C above normal. Note: the green line in P1, P2, and P3, adn the black line in P4 show net zero emissions happening about mid-century.

Longer Delay Requires More CDR… “All analyzed pathways limiting warming to 1.5°C with no or limited overshoot use CDR to some extent to neutralize emissions from sources for which no mitigation measures have been identified and, in most cases, also to achieve net negative emissions to return global warming to 1.5°C following a peak (high confidence). The longer the delay in reducing CO2 emissions towards zero, the larger the likelihood of exceeding 1.5°C, and the heavier the implied reliance on net negative emissions after mid-century to return warming to 1.5°C (high confidence).”
IPCC 1.5 C Report, Chapter 2, 2018, Page 96, 7th paragraph.
https://www.ipcc.ch/site/assets/uploads/sites/2/2019/05/SR15_Chapter2_Low_Res.pdf
Longer Delay Requires More CDR (#2)… “The amount of compensatory CDR remains roughly the same over the century. This is the net effect of stronger deployment of compensatory CDR until mid-century to accelerate the approach to carbon neutrality and less compensatory CDR in the second half of the century due to deeper mitigation of end-use sectors in 1.5°C-consistent pathways (Luderer et al., 2018).”
IPCC 1.5 C Report, Chapter 2, 2018, Page 122, last paragraph.
https://www.ipcc.ch/site/assets/uploads/sites/2/2019/05/SR15_Chapter2_Low_Res.pdf
(15) Evolutionary Boundaries – The Natural Range of Our Old Climate… There is an overarching need to restore climate that is almost absent in climate science. This is a tenth grade science class concept of collapse of biologic systems when they move beyond their evolutionary boundaries. When systems collapse, or re-evolves to meet new boundary conditions, their environmental services are degraded, lost, and often reversed. With greenhouse gases, this means natural systems emit greenhouse gases instead of absorbing or sequestering them. These systems are, or are related to Earth systems and climate tipping, and we know that more than half of climate tipping systems are now active at 1.0 C, when widespread consensus science reporting suggested tipping would not occur until after 5 C warming. (Lenton 2019, Reference 9)
There are a number of papers that can be interpreted to identify this evolutionary boundary of our old climate at about 0.5 C degrees warming above preindustrial times, which is fundamentally the natural variability of our old climate. Because climate change beyond 0.5 C warming at first only begins the process of degradation, biological collapse increases markedly with time. This means that the overly extreme mayhem we have been seeing over the last half decade have only occurred since we warmed about 0.75 degrees C. Because impacts increase nonlinearly with warming, if we only hold warming to the global target of 1.5 degrees C above normal, future extremes will increase dramatically from today.
King 2015 defines “anthropogenic emergence,” or the time at which humankind’s emissions changed our climate beyond its natural evolution as the point where our climate warmed beyond its stable natural variability, as some point near or not too long after the year 2000, where we warmed beyond 0.5 degrees C above normal.
King et al., The timing of anthropogenic emergence in simulated climate extremes, Environmental Research Letters, September 10, 2015.
https://iopscience.iop.org/article/10.1088/1748-9326/10/9/094015/pdf
Hansen 2017 “Young people’s burden…” defines the maximum warming or our old climate, or the maximum range of natural variability of our old climate as 0.25 to 0.75 C warming, with a midpoint of 0.5 C.
Hansen, Young People’s Burden: Requirement of Negative CO2 Emissions, Earth Systems Dynamics, July 18, 2017, Figure 12.
https://www.earth-syst-dynam.net/8/577/2017/esd-8-577-2017.pdf
Lenton’s tipping point article tells us more than half of known tipping points have activated since about 2010, which coincides well with climate change warming beyond 0.5 C.
Lenton et al., Climate tipping points-too risky to bet against, Nature, November 27, 2019
https://www.nature.com/articles/d41586-019-03595-0
Randers and Goluke 2020 have identified a tipping point with permafrost collapse of 0.5 C warming.
Randers and Goluke, An earth system model shows self-sustained melting of permafrost even if all man-made GHG emissions stop in 2020, Nature Scientific Reports, November 12, 2020.
https://www.nature.com/articles/s41598-020-75481-z