
Background: Permafrost Collapse is Underway With Emission Plausibly Rivaling All of Global Transportation… Across the Northern Hemisphere, permafrost melt emitted 630 TgC, or 2.3 gigatons (Gt) CO2 (not including methane) on average every year from 2003 to 2017 as per findings from Natali et al., 2019, that tells us, “We estimate a contemporary loss of 1,662 TgC per year from the permafrost region during the winter season (October–April). This loss is greater than the average growing season carbon uptake for this region estimated from process models (−1,032 TgC per year).” Of critical note, emissions are average per year from 2003 – 2017. With permafrost melt increasing rapidly today, and permafrost likely being stable and sequestering in 2003, this means emission in 2017 were much more than in 2003, therefore emissions today are much more than the 2.3 Gt per year estimated average, quite likely double the 2.3 Gt and possibly triple or quadruple, rivalling global transportation CO2 emissions of about 10 Gt per year.
Permafrost Collapse Irreversible With Complete Net-zero Tomorrow… Randers and Goluke just published a piece in Nature that reveals the importance of Earth systems tipping collapses if we do not achieve climate restoration that is basically described as 0.5 C warming above normal or less. Net-zero emissions alone allow runaway permafrost collapse. The tipping threshold has been crossed. It cannot be reversed unless we cool Earth to a temperature that is below the tipping threshold. This means, as the Randers and Goluke say,
To stop the self-sustained warming, enormous amounts of CO2
have to be extracted from the atmosphere.
This modeling experiment is a net zero, 300 ppm CO2, 2.0 degrees C at 2150 model (See Figure 1). Fundamentally, 300 ppm CO2 at 2150 is too late. (We are at 411 ppm average in 2019 but not in equilibrium. At 2100 the equilibrium temperature/CO2 concentration is: 1.5 C is about 410 ppm CO2 at 2100, 1.0 C is about 350 ppm CO2 at 2100.) Two net-zero alone scenarios were modeled with Randers and Goluke. #1 is net-zero at 2100, #2 is net-zero at 2020. Self-sustaining feedbacks cause both scenarios to continue to warm once excess GHG concentrations falls to equilibrium about 2150.
Different from other modeling, besides this is being a simple model with many fewer parameters than most, is the extra carbon emitted from permafrost collapse of about 675 Gt carbon as CO2 through 2300. This is an average of 2.4 Gt carbon as CO2 in 280 years, or only slightly more than the 2.3 Gt average annual CO2 emissions from permafrost on average from 2003 to 2017 so it is likely Randers and Goluke are understated.
There is lots of criticism of Randers and Goluke for being a simple model, which is premature for several reasons. One is that early climate models were very simple and their results hold up today. Another is the similarity of carbon dioxide removal needed when compared to static calculations. There is 1,000 Gt extra CO2 remaining in the atmosphere from our historic emissions of excess greenhouse gases and if we are to stop climate change we must remove much if not most of it. The Intergovernmental Panel on Climate Change’s 1.5 C Report says 100 to 1,000 Gt CO2 removal is needed to meet a 1.5 C target at 2100 and heavy emphasis here needs to be placed on the worst-case scenario of 1,000 Gt.
Randers and Goluke tell us that to reverse uncontrollable permafrost collapse, “all man-made emissions would have had to be cut to zero sometime between 1960 and 1970—when global warming was still below some + 0.5 °C.” This tells us two things: The amount of CO2 we must remove from the atmosphere is the difference between the concentration at say 1965, and today, or about 745 Gt CO2, and the threshold temperature of + 0.5 °C aligns surprisingly well with the limits of natural variation in our old climate of about + 0.5 °C. (King 2015)
The reason why this modeling shows we are too warm already is the water vapor feedback and the albedo feedback. At our current temperature (or warmer) the largest of all feedbacks from water vapor slowly increases the global temperature, allowing more water vapor to be held in the atmosphere, further increasing temperature. The second feedback is ARctic greening which is already irreversible in time frames that matter. Our warmer climate has allowed shrubs and trees to grow up in the tundra where they have not grown in hundreds of thousands of years. When taller vegetation is not covered with snow, it absorbs up to nine times more sunlight energy and changes it to hear, compared to highly reflective snow that bounces sunlight right back into space.
What happens with net zero alone is all temperature driven. Global temperature does not fall below 2.0 C above normal keeping water vapor high and albedo low, allowing the temperature to remain high.
Randers and Goluke find that we need to remove 7 to 10 Gt carbon, or 33 Gt CO2eq from the atmosphere every year through 2300. (supplemental material Fig 14b). Atmospheric CO2 falling to minimum ice age levels of +/- 150 ppm with temperature peaking a little after 2050 AT 1.7 C. But 1.7 C allows tipping to complete, so we simply must remove much more CO2eq faster to get the temperature down to historic natural variation to eliminate excess warming from water vapor and albedo feedback loops.
To summarize:
This is a simple model, but simple models in the past have held up well.
Net zero alone tomorrow is 300 ppm CO2 and 2.0 C at 2150 (with overshoot to 2.4 C) and even though CO2 remains stable, water vapor and albedo loss create feedbacks that increase temperature.
CDR of up to 33 Gt CO2eq lowers the temperature to about 0.5 C (the upper limit of natural variation) with CO2 at ice age minimums.
To prevent feedbacks from taking control, CDR needs to be greater than 33 Gt CO2eq annually,
Rapid repetition of this experiment with more complicated modeling is badly needed to help understand the quantity and timing of CDR needed, and if emergency geoengineering cooling is needed immediately.
This modeling also seems to verify:
That the maximum limit of natural variability of 0.5 C above normal is the threshold of the water vapor/albedo feedback,
A safe temperature is less than 0.5 C degrees above normal,
The safe CO2 concentration (with this simple model) is ice age low. This is worrisome and –I think more complicated models will raise this one, but it is meaningful for now to the plausible need for emergency cooling.
References:
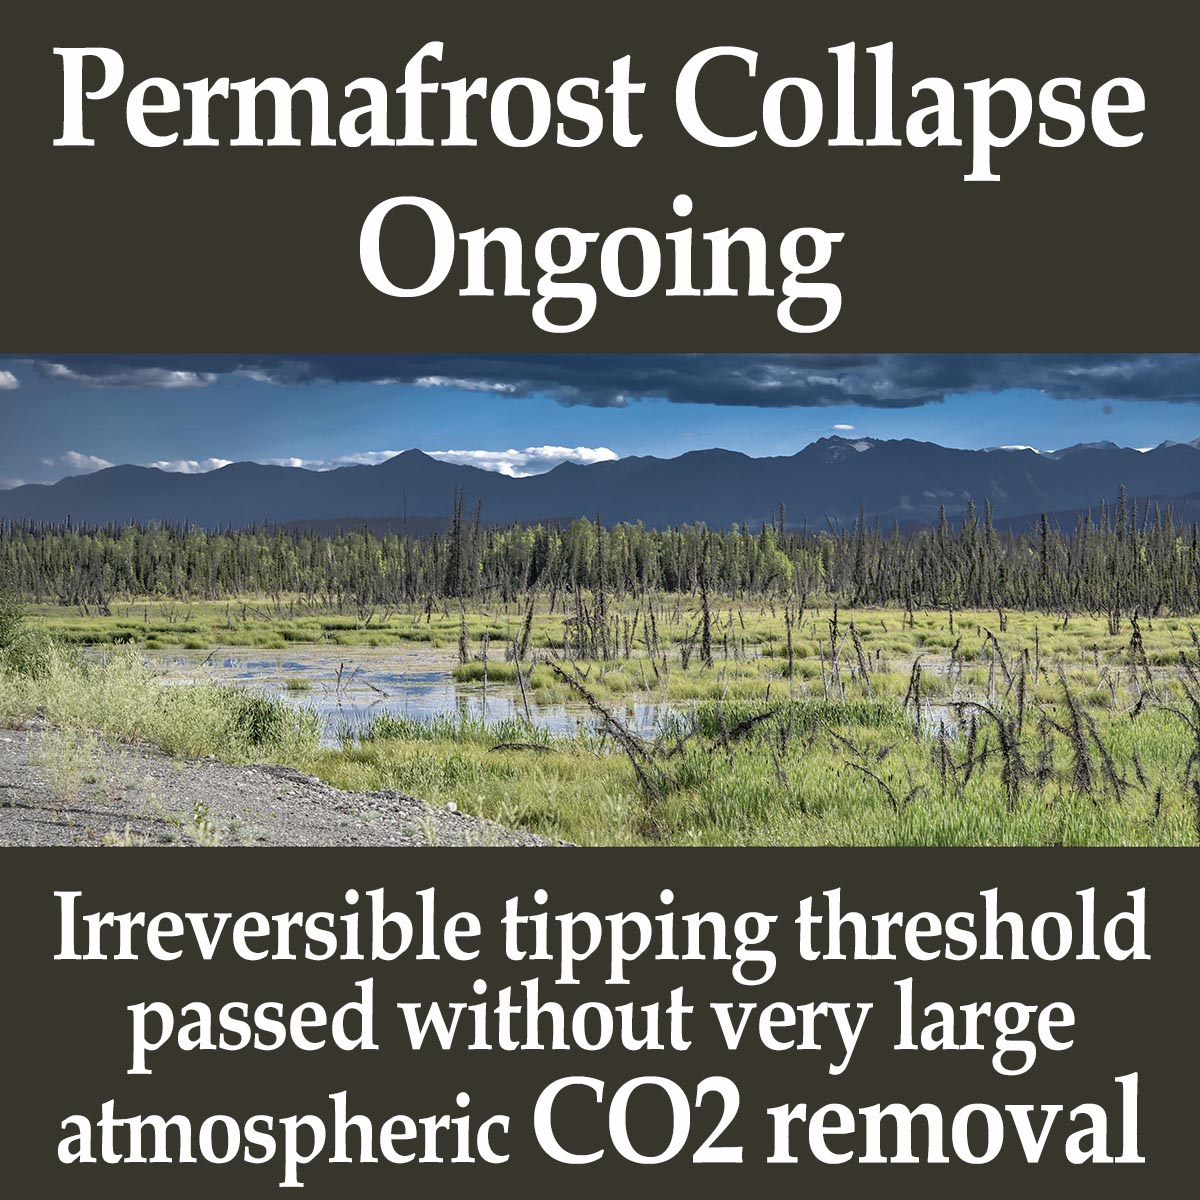
Cover Image: Permafrost collapse Alaska Highway, Southern Yukon, Canada, 2018
Natali et al., Large loss of CO2 in winter observed across the northern permafrost region, Nature Climate Change, October 21, 2019.
https://www.uarctic.org/media/1600119/natali_et_al_2019_nature_climate_change_s41558-019-0592-8.pdf
Randers and Goluke, An earth system model shows self-sustained melting of permafrost even if all man-made GHG emissions stop in 2020, Nature Scientific Reports, November 12, 2020.
https://www.nature.com/articles/s41598-020-75481-z
Supplemental Materials
https://static-content.springer.com/esm/art%3A10.1038%2Fs41598-020-75481-z/MediaObjects/41598_2020_75481_MOESM1_ESM.pdf
King et al., The timing of anthropogenic emergence in simulated climate extremes, Environmental Research Letters, September 10, 2015.
https://iopscience.iop.org/article/10.1088/1748-9326/10/9/094015/pdf