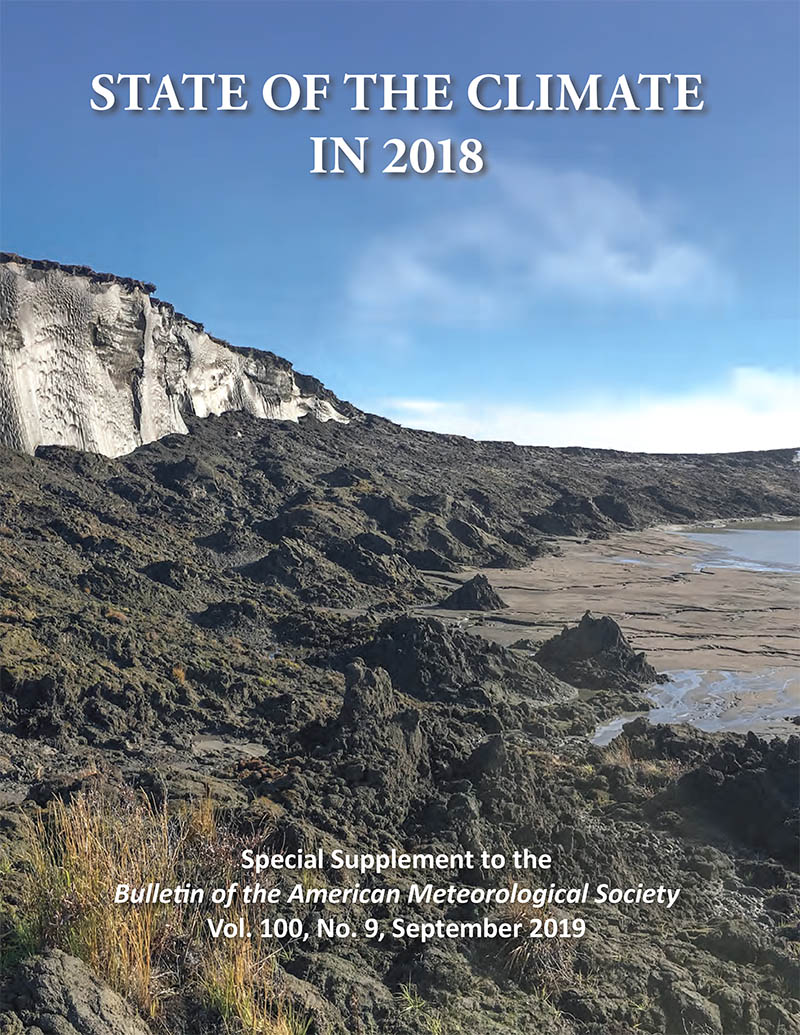

Ice-rich permafrost exposed on the face of Itkillik Bluff on the North Slope of Alaska.
Unsurprisingly, we have roundly exceeded climate norms in our old climate. Records continue to be broken and climate statistics broadly show we are exceeding or near the leading edge of warming in recent years, as would be expected from a climate that continues to warm, that has exceeded the stable state of the past. Beginning in the early 1990s, climate scientists said that as warming increases in the future, almost every year will set new warming records. Well, here we are and they are listed below.
(Global Warming Psychology Note: Give hope! We can restore our climate. It’s no more difficult than treating human sewage pollution. It’s a big job, but so is treating human sewage pollution and not near as messy! Ew!)
The global average temperature in 2018 was the fourth warmest year after 2016, 2015, and 2017, with 2016 and 2017 being Super El Nino years and 2017 and 2018 continuing to rebound to the normal upward trend from prior to the El Nino event. (2016 was 0.99 C above normal, 2018 was 0.82 C above normal.) Every year since the start of the twenty-first century has been warmer than the 1981–2010 global average and the 1981 to 2010 global average is significantly warmer than the 20th century average.
Permafrost continues to warm with an average increase of 0.1°–0.2°C (0.18 to 0.36 F) between 2017 and 2018, similar to the maximum rate observed in the record.
Beginning of summer Arctic snow cover in June was near half of what it was 35 years ago.
Arctic sea ice coverage was the second lowest in the 38-year record, higher only than 2017.
Antarctica as a whole experienced its second highest maximum temperature on record. The Antarctic Peninsula temperature maximum reached 8 C (16.4 F) above the long term average.
About three feet of ice melted off the top of the average glacier in 2018, totaling 79 feet since 1980.
The global sea surface temperature decreased slightly in 2018, continuing a trend back to normal from before the Super El Nino of 2016. The deep ocean continues to warm.
Wildfire in 2018 was the lowest recorded since 1997, continuing the long-term
downward trend in fire emissions. But, wildfires burned 30 percent more than average in the US in 2018. U.S. wildfire damages exceeded $40 billion.
The global sea level rise record streak continues for the seventh consecutive year.
In 2018 globally, the number of hottest ten percent of days increased from 40 to 60 and coolest 10 percent decreased from 40 to 20, from 1950 to current, almost all of the change happening since 1990. The hottest ten percent of days across much of Europe, Australia, and the southwestern United States were around double the number of days in our old climate with only Canada and a small area of northwestern Africa seeing fewer ten percent warm days. All this occurred with a backdrop of a La Nina in the Pacific, which would normally produce cooler than normal temperatures.
Exceptions in 2018 were the eastern US in autumn and northern Europe in spring when the polar vortex collapsed from sudden stratospheric warming creating all-time record lows.
Global precipitation change over the 1980 to 2010 average ranged from -5 mm to +78 mm (-0.2 to 3.1 inches) in six models with the newer models in the upper half of the range. This continues to indicate the challenges we still face with precipitation knowledge vs temperature analysis that is more robust. Nonetheless, the typical 40 mm (1.6 inches) percent increase is substantial.
The US Climate Extremes Index in 2018 for precipitation was in the top ten percent for the 1-day event. Three other years in the last ten years have also been in the top ten percent (2010, 2015, 2017. On average, the top ten percent should only be experienced on average once every ten years.
Globally, the annual lower troposphere temperature (below 40,000 to 50,000 feet; where all weather happens) was third to seventh highest, depending on the
dataset analyzed. The lower stratospheric temperature (above 40,000 to 50,000 feet) was about the fifth lowest. This absolutely consistent with modeling and physics, where more global warming gases in the lower atmosphere reduce the amount of heat escaping to space, which results in lower upper atmospheric temperature.
The 2018 tropical cyclone season was unusually active and contributed to 35% of global losses, and a northward shift of cyclones confirming modeling results on a warmer planet.